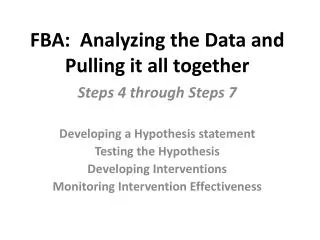
Download
1 / 15
170 likes | 319 Views
This lecture provides an in-depth overview of experimental design, focusing on essential components such as formulating hypotheses, planning experiments, and analyzing results. It covers the stages of experimental planning, from defining research questions to data collection and statistical analysis. The importance of ecological validity versus controlled conditions, as well as the significance of variable selection and bias control, are also discussed. Students will gain insights into quantitative methods in Human-Computer Interaction (HCI) and learn how to derive meaningful conclusions from their experimental data.

E N D
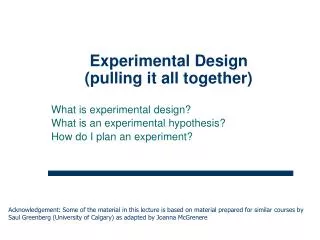
Experimental Design(pulling it all together) What is experimental design? What is an experimental hypothesis? How do I plan an experiment? Acknowledgement: Some of the material in this lecture is based on material prepared for similar courses by Saul Greenberg (University of Calgary) as adapted by Joanna McGrenere
The Planning Flowchart Stage 1 Stage 2 Stage 3 Stage 4 Stage 5 Problem Planning Conduct Analysis Interpret- definition research ation feedback research define data interpretation pilot idea variables reductions testing generalization literature review controls statistics data reporting collection apparatus hypothesis statement of testing problem procedures hypothesis select development subjects experimental design feedback
What’s the goal? • Overall research goals impact choice of study design • Exploratory research vs. hypothesis confirmation • Ecological validity vs tightly controlled • Study research questions impact choice of: • Protocol, task • Experimental conditions (factors) • Constructs (effectiveness) • Measures (task completion, error rate) • Testable hypotheses impact • choice of statistical analysis (also impacted by nature of the data and experimental design)
The Planning Flowchart Stage 1 Stage 2 Stage 3 Stage 4 Stage 5 Problem Planning Conduct Analysis Interpret- definition research ation feedback research define data interpretation pilot idea variables reductions testing generalization literature review controls statistics data reporting collection apparatus hypothesis statement of testing problem procedures hypothesis select development subjects experimental design feedback Reality check: does the final design support the research questions
Quantitative system evaluation • Quantitative: • precise measurement, numerical values • bounds on how correct our statements are • Methods • Controlled Experiments • Statistical Analysis • Measures • Objective: user performance (speed & accuracy) • Subjective: user satisfaction
descriptive statistics Quantitative methods 1. User performance data collection • data is collected on system use • frequency of request for on-line assistance • what did people ask for help with? • frequency of use of different parts of the system • why are parts of system unused? • number of errors and where they occurred • why does an error occur repeatedly? • time it takes to complete some operation • what tasks take longer than expected? • collect heaps of data in the hope that something interesting shows up • often difficult to sift through data unless specific aspects are targeted (as in list above)
Quantitative methods ... 2. Controlled experiments The traditional scientific method • clear convincing result on specific issues • In HCI: • insights into cognitive process, human performance limitations, ... • allows comparison of systems, fine-tuning of details ... Strives for • lucid and testable hypothesis (usually a causal inference) • quantitative measurement • measure of confidence in results obtained (inferential statistics) • replicability of experiment • control of variables and conditions • removal of experimenter bias
File Edit View Insert File New Edit New Open Open View Close Insert Close Save Save The experimental method a) Begin with a lucid, testable hypothesis H0: there is no difference in user performance (time and error rate) when selecting a single item from a pop-up or a pull down menu, regardless of the subject’s previous expertise in using a mouse or using the different menu types
The experimental method b) Explicitly state the independent variables that are to be altered Independent variables • the things you control (independent of how a subject behaves) • two different kinds: • treatment manipulated (can establish cause/effect, true experiment) • subject individual differences (can never fully establish cause/effect) in menu experiment • menu type: pop-up or pull-down • menu length: 3, 6, 9, 12, 15 • expertise: expert or novice
The experimental method c) Carefully choose the dependent variables that will be measured Dependent variables • variables dependent on the subject’s behaviour / reaction to the independent variable • Make sure that what you measure actually represents the higher level concept! in menu experiment • time to select an item • selection errors made • Higher level concept (user performance)
Expert Novice The experimental method d) Judiciously select and assign subjects to groups Ways of controlling subject variability • recognize classes and make them an independent variable • minimize unaccounted anomalies in subject group superstars versus poor performers • use reasonable number of subjects and random assignment
Now you get to do the pop-up menus. I think you will really like them... I designed them myself! The experimental method... e) Control for biasing factors • unbiased instructions + experimental protocols prepare ahead of time • double-blind experiments, ... • Potential confounding variables • Order effects • Learning effects • Counterbalancing (http://www.yorku.ca/mack/RN-Counterbalancing.html)
The experimental method f) Apply statistical methods to data analysis • Confidence limits: the confidence that your conclusion is correct • “The hypothesis that mouse experience makes no difference is rejected at the .05 level” (i.e., null hypothesis rejected) • means: • a 95% chance that your finding is correct • a 5% chance you are wrong g) Interpret your results • what you believe the results mean, and their implications • yes, there can be a subjective component to quantitative analysis
Within/Between Subject designs • Know when to use each • Be able to discuss the Advantages/Disadvantages