Download

1 / 60
670 likes | 1.14k Views
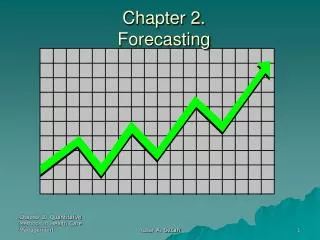
Operations Management Forecasting Chapter 4 - Part 2. Forecasting a Trend. Trend is increasing or decreasing pattern. First, plot data to verify trend. If trend exists, then moving averages and exponential smoothing will always lag. 20. Actual. 16. 12. 8. 4. 1. 4. 5. 2. 3. 6.

E N D
Forecasting a Trend • Trend is increasing or decreasing pattern. • First, plot data to verify trend. • If trend exists, then moving averages and exponential smoothing will always lag.
20 Actual 16 12 8 4 1 4 5 2 3 6 Period Plot Data
Moving Averages for a Trend MA Error MA Period Sales 1 8 2 11 3 13 4.33 4 15 10.67 6.00 13.00 5 19 15.67 ? 6 MA = 3 period Moving Average
Trend Graph 20 Actual 16 MA Forecast 12 8 4 1 4 5 2 3 6 Period
Exponential Smoothing for a Trend MA Error ES Error ES MA Period Sales 1 8 11 2 11 11 3 13 4.33 12 4 15 10.67 3.0 6.00 13.5 13.00 5 19 5.5 15.67 ? 6 16.25 ? MA = 3 period Moving Average ES = Exponential Smoothing with =0.5 (F2=11)
20 ES Forecast Actual 16 MA Forecast 12 8 4 1 4 5 2 3 6 Period Trend Graph
Forecasting a Trend • Moving Averages and (simple) Exponential Smoothing are always poor. • For a linear trend can use: • Exponential Smoothing with Trend Adjustment (skip: pp. 90-92). • Linear Trend Projection (linear regression). • For non-linear trend can use: • Non-linear regression techniques.
Linear Trend Projection • Used for forecasting linear trend line. • PLOT TO VERIFY LINEAR RELATIONSHIP • Assumes linear relationship between response variable, Y, and time, X. • Y = a + bX • a = y-axis intercept; b = slope • Estimated by least squares method. • Minimizes sum of squared errors.
Plot of X,Y Data Actual observation Values of Dependent Variable (Y) Time (x)
Least Squares Actual observation Deviation Deviation Deviation Deviation Values of Dependent Variable (Y) Deviation Point on regression line Deviation Deviation Time (x)
Least Squares • Least squares line minimizes sum of squared deviations. • This reduces large errors. • Similar to MSE. • Deviations around least squares line are assumed to be random.
Equation: Slope (p. 94): Y-Intercept: Least Squares Equations
Period (x) Sales (y) x2 xy 1 1 8 8 4 2 11 22 39 9 3 13 60 16 4 15 25 5 19 95 x=3 xy=224 x2=55 y=13.2 Linear Trend Projection Example
Period (x) TP Err. Sales (y) ES Err. MA Err. ES MA TP 1 8 11 2 11 11 3 13 12 4 15 10.67 15.8 3.0 4.33 -0.8 13.5 18.4 13.00 5 19 0.6 5.5 6.00 15.67 6 16.25 21.0 Linear Trend Projection Example TP = Trend Projection: Y = 5.4 + 2.6x Small errors!
20 Actual 16 12 8 4 1 4 5 2 3 6 Period Trend Graph TP Forecast ES Forecast MA Forecast
Models with Seasonality • Use if data exhibits seasonal patterns. • Daily, weekly, monthly, yearly. • Compute seasonal component. • Remove seasonality and forecast. • Factor in seasonal component. • See pages 96-100.
Associative Forecasting Methods • Identify Independent and dependent variable. • Dependent variable (y): Entity to be forecast (demand). • Independent variable (x): Used to predict (or explain) dependent variable. • Determine relationship. • Plot data. • Consider time lags. • Calculate parameters. • Forecast. • Monitor.
Linear Regression • Linear relationship between dependent & explanatory variables. • Example: Sales in month i (Yi ) depends on advertising in month i (Xi ) (eg. number of ads) • Sales may also depend on advertising in previous months! Y a + b X = i i Independent variable (number of ads). Dependent variable (sales).
Least Squares Actual observation Deviation Deviation Deviation Deviation Values of Dependent Variable (Y) Deviation Point on regression line Deviation Deviation Values of Independent Variable (x)
Equation: Y-Intercept: Linear Regression Equations(same as before) Slope:
Interpretation of Coefficients • Slope (b): • Y changes by b units for each 1 unit increase in X. • If b = +2, then sales (Y) is forecast to increase by 2 for each 1 unit increase in advertising (X). • Y-intercept (a): • Average value of Y when X = 0. • If a = 4, then average sales (Y) is expected to be 4 when advertising (X) is 0.
Least Squares • Plot data to verify linearity! • If curve is present, use non-linear regression. • Forecast only in (or near) range of observed values! • May need future values of independent variable to make forecast. • Example: Summer hotel demand may depend on summer gasoline price.
Monthly Sales vs. Number of Ads Sales 0 Number of TV ads per month
Least Squares Line What is sales forecast for small number of ads? Sales 0 Number of TV ads per month
Forecasting Outside Range of Observed Values is Unreliable Forecast is for negative sales! Sales 0 Number of TV ads per month
Correlation • Answers: ‘How strongis the linear relationship between the variables?’ • Coefficient of correlation - r • Measures degree of association; ranges from -1 to +1 • Coefficient of determination - r2 • Amount of variation explained by regression equation. • Used to evaluate quality of linear relationship.
r = +1 r = -1 Y Y X X r = .89 r = 0 Y X X Coefficient of Correlation Y
Guidelines for Selecting Forecasting Model • You want to achieve: • No pattern or direction in forecast error. • Error = Actual - Forecast • Small forecast error. • Mean square error (MSE). • Mean absolute deviation (MAD). • Mean absolute percentage error (MAPE).
Desired Pattern Trend Not Fully Accounted for Error Error 0 0 Time Time Pattern of Forecast Error
Selecting Forecasting Model Example You’re a marketing analyst for Hasbro Toys. You’ve forecast sales with a linear regression model & exponential smoothing. Which model do you use? Linear Regression Exponential Actual Model Smoothing YearSales Forecast Forecast (.9) 1 1 0.6 1.00 2 1 1.3 1.00 3 2 2.0 1.00 4 2 2.7 1.90 5 4 3.4 1.99
Y F’cast Error Error2 |Error| Year i 1 1 0.6 0.4 0.16 0.4 2 1 1.3 -0.3 0.09 0.3 3 2 2.0 0.0 0.00 0.0 4 2 2.7 -0.7 0.49 0.7 5 4 3.4 0.6 0.36 0.6 Total 0.0 2.0 Linear Regression Model 1.10 MSE = Σ Error2 / n = 1.10 / 5 = 0.220 MAD = Σ |Error| / n = 2.0 / 5 = 0.400 MAPE = Σ[|Error|/Actual]/n = 1.2/5 = 0.24 = 24%
Y Year F’cast Error Error2 |Error| i 1 1 1.00 0.0 0.00 0.0 2 1 1.00 0.0 0.00 0.0 3 2 1.00 1.0 1.00 1.0 4 2 1.90 0.1 0.01 0.1 5 4 2.01 4.04 2.01 Total 0.3 5.05 3.11 Exponential Smoothing Model 1.99 MSE = Σ Error2 / n = 5.05 / 5 = 1.01 MAD = Σ |Error| / n = 3.11 / 5 = 0.622 MAPE = Σ[|Error|/Actual]/n = 1.0525/5 = 0.2105 = 21%
Which is Better??? Linear Regression Model: MSE = Σ Error2 / n = 1.10 / 5 = 0.220 MAD = Σ |Error| / n = 2.0 / 5 = 0.400 MAPE = Σ[|Error|/Actual]/n = 1.2/5 = 0.24 = 24% Exponential Smoothing Model: MSE = Σ Error2 / n = 5.05 / 5 = 1.01 MAD = Σ |Error| / n = 3.11 / 5 = 0.622 MAPE = Σ[|Error|/Actual]/n = 1.0525/5 = 0.2105 = 21%
Tracking Signal • Measures how well the forecast is predicting actual values. • To use: • Calculate tracking signal each time period. • Ratio of running sum of forecast errors (RSFE) to mean absolute deviation (MAD). • Plot tracking signal on graph. • Good tracking signal has low values. • Should be within upper and lower control limits (often based on MAD).
Plot of a Tracking Signal Signal exceeded limit Tracking signal Upper control limit + 0 MAD Acceptable range - Lower control limit Time
Cum Mo F’cst Act RSFE MAD TS Error |Error| 1 100 90 Tracking Signal - Month 1
Cum Mo F’cst Act RSFE MAD TS Error |Error| -10 -10 1 100 90 Error = Actual - Forecast = 90 - 100 = -10 RSFE = Errors = -10 Tracking Signal - Month 1
Cum Mo F’cst Act RSFE MAD TS Error |Error| -10 10 -10 1 100 90 Cum |Error| = |Errors| = 10 Tracking Signal - Month 1
Cum Mo F’cst Act RSFE MAD TS Error |Error| -10 10 -10 1 100 90 10.0 MAD = |Errors|/n = 10/1 = 10 Tracking Signal - Month 1
Cum Mo F’cst Act RSFE MAD TS Error |Error| -10 10 -10 1 100 90 10.0 -1 TS = RSFE/MAD = -10/10 = -1 Tracking Signal - Month 1
Cum Mo F’cst Act RSFE MAD TS Error |Error| -10 10 -10 1 100 90 10.0 -1 2 99 94 Tracking Signal - Month 2
Cum Mo F’cst Act RSFE MAD TS Error |Error| -10 10 -10 1 100 90 10.0 -1 -5 2 99 94 Error = Actual - Forecast = 94 - 99 = -5 Tracking Signal - Month 2
Cum Mo F’cst Act RSFE MAD TS Error |Error| -10 10 -10 1 100 90 10.0 -1 -15 -5 2 99 94 RSFE = Errors = (-10) + (-5) = -15 Tracking Signal - Month 2
Cum Mo F’cst Act RSFE MAD TS Error |Error| -10 10 -10 1 100 90 10.0 -1 -15 15 -5 2 99 94 Cum Error = |Errors| = 10 + 5 = 15 Tracking Signal - Month 2
Cum Mo F’cst Act RSFE MAD TS Error |Error| -10 10 -10 1 100 90 10.0 -1 -15 15 -5 2 99 94 7.5 MAD = |Errors|/n = 15/2 = 7.5 Tracking Signal - Month 2
Cum Mo F’cst Act RSFE MAD TS Error |Error| -10 10 -10 1 100 90 10.0 -1 -15 15 -5 2 99 94 7.5 -2 TS = RSFE/MAD = -15/7.5 = -2 Tracking Signal - Month 2
Cum Mo F’cst Act RSFE MAD TS Error |Error| -10 10 -10 1 100 90 10.0 -1 -15 15 -5 2 99 94 7.5 -2 30 10 0 15 0 3 98 113 Tracking Signal - Month 3


![Statistical Forecasting [Part 2]](https://cdn0.slideserve.com/1092555/statistical-forecasting-part-2-dt.jpg)