Download
1 / 51
510 likes | 690 Views
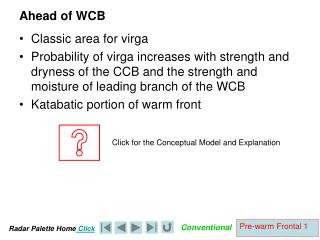
Ahead of WCB. Classic area for virga Probability of virga increases with strength and dryness of the CCB and the strength and moisture of leading branch of the WCB Katabatic portion of warm front – winds veer above the warm frontal mixing zone

E N D
Ahead of WCB • Classic area for virga • Probability of virga increases with strength and dryness of the CCB and the strength and moisture of leading branch of the WCB • Katabatic portion of warm front – winds veer above the warm frontal mixing zone • Lack of precipitation in this area may limit Doppler interpretation Click for the Conceptual Model and Explanation
B Warm Frontal Cross-section along Leading Branch of the Warm Conveyor Belt (WCB) Common location for virga A WCB WCB oriented for maximum frontal lift Virga Precipitation Increasing CCB Moistening WCB oriented for less frontal lift Lower Hydrometeor Density Mixing Zone Surface Warm Front CCB Link to Classic Example B A Cold air in Cold Conveyor Belt (CCB) deep and dry Moist portion of Warm Conveyor Belt (WCB) is high and veered from frontal perpendicular – katabatic tendency Dry lower levels of WCB originate from ahead of the system and backed from frontal perpendicular WCB typically veers with height (it is after all, a warm front) Frontal slope is more shallow than the typical 1:200 Precipitation extends equidistant into the unmodified CCB Precipitation extends further into the moistened, modified CCB
C C C WCB DCB CCB DCB Vertical Deformation Zone Distribution and the CBMSimplified Summary The WCB overrides the warm front The CCB undercuts the warm front The frontal surface overlies the mixing layer Wind shear in the CCB is variable • Looking along the flow: • In WCB to the right of the Col expect veering winds with height – Katabatic warm front • In WCB approach to the Col expect maximum divergence – the eagle pattern with ascent and increasing pcpn • In WCB to the left of the Col expect backing winds with height – Anabatic warm front
C C C WCB DCB CCB DCB Vertical Deformation Zone Distribution and the CBMSimplified Flows in the Vertical Above frontal surface: Winds back with Height and distance from Xl Above frontal surface: Winds veer with Height and distance from Xr Below frontal surface: Winds could veer or back but likely veer Below frontal surface: Winds could veer or back Xc Xr Xl Warm Sector: Winds back with Height and distance from Xl Warm Sector: Winds veer with Height and distance from Xr No VWS
C o Warm frontal surface Mixing layer Cold CB Warm CB WCB to the Right of the Col The Warm Right Wing Stoop CM The eagles right wing is folded in as if it is about to swoop down. The left wing is still fully extended to catch the lift of the WCB. Signature of Warm Frontal surface Warm advection • Within the CCB: • Probable Ekman spiral nearest surface • Probable cold advection above Ekman spiral Right Wing Left Wing • Within the WCB: • East of radar veering, warm advection • West of radar nil VWS
C o WCB Approaching the Col The Warm Screaming Eagle CM Both wings are fully extended to catch the lift of the WCB. This is a divergent signature. Warm CB Warm frontal surface Signature of Warm Frontal surface discontinuity Mixing layer • Within the CCB: • Probable Ekman spiral nearest surface • Probable cold advection above Ekman spiral Cold CB Right Wing Left Wing • Within the WCB: • East of radar veering, warm advection – katabatic warm front. • West of radar backing, cold advection – anabatic warm front.
Need to emphasize The PPI nature of the Doppler scan - The cone D A G C B E F H The Warm Screaming Eagle Conceptual Model
Inactive or Katabatic Warm Front Active or Anabatic Warm Front Approaching the Col the Warm Front should have characteristics intermediate between the Anabatic Warm Front to the Left of the Col and the Katabatic Warm Front to the Right of the Col
B A The PPI Virga Hole Signature – Typical in this Region of the CBCM • The difference between PPI and CAPPI displays can be used to advantage. Each display must be consulted in an analysis of the atmosphere. This is most often seen in Doppler Radar which is typically a PPI display. Cross-section from A (left) to B (right) 1.5km CAPPI 3.5 PPI Virga Hole The Virga Hole signature is only revealed in the PPI radar display. The CAPPI cannot reveal the true extent of the precipitation if the precipitation lies above the CAPPI level. A cross-section can reveal the vertical distribution of the precipitation. The lowest level CAPPI display can be misleading as at longer ranges, the true level of the radar rises to follow the lowest PPI scan of the radar. This is depicted in this 1.5km CAPPI example. Click.
Under WCB • Virga only likely on the leading edge of the WCB • The CCB is becoming increasingly moist • Frontal overrunning and isentropic lift is increasing thus increasing the intensity of the precipitation process. • Warm front becoming more likely Anabatic Click for the Conceptual Model and Explanation
B Warm Frontal Cross-section along Central Branch of the Warm Conveyor Belt (WCB) A Common location for virga WCB WCB oriented for maximum frontal lift Virga Precipitation Increasing CCB Moistening Lower Hydrometeor Density Mixing Zone Precipitation At Surface Surface Warm Front CCB B A Cold air in Cold Conveyor Belt (CCB) more shallow and moist Moist portion of Warm Conveyor Belt (WCB) is thicker, higher and perpendicularto front Lower levels of WCB have the same origin as the upper level of the WCB - frontal perpendicular WCB shows little directional shift with height. A greater WCB depth is frontal perpendicular Frontal slope is near the typical 1:200 Precipitation extends further into the moistened, modified CCB. Horizontal rain area begins to expand as CCB moistens.
C C C WCB DCB CCB DCB Vertical Deformation Zone Distribution and the CBMSimplified Summary The WCB overrides the warm front The CCB undercuts the warm front The frontal surface overlies the mixing layer Wind shear in the CCB is variable • Looking along the flow: • In WCB to the right of the Col expect veering winds with height – Katabatic warm front • In WCB approach to the right of the Col expect maximum divergence – the eagle pattern with ascent and increasing pcpn • In WCB to the left of the Col expect backing winds with height – Anabatic warm front
C o WCB Approaching the Col The Warm Screaming Eagle CM Both wings are fully extended to catch the lift of the WCB. This is a divergent signature. Warm CB Warm frontal surface Signature of Warm Frontal surface discontinuity Mixing layer • Within the CCB: • Probable Ekman spiral nearest surface • Probable cold advection above Ekman spiral Cold CB Right Wing Left Wing • Within the WCB: • East of radar veering, warm advection – katabatic warm front. • West of radar backing, cold advection – anabatic warm front.
Need to emphasize The PPI nature of the Doppler scan - The cone D A G C B E F H The Warm Screaming Eagle Conceptual Model
Inactive or Katabatic Warm Front Active or Anabatic Warm Front Approaching the Col the Warm Front should have characteristics intermediate between the Anabatic Warm Front to the Left of the Col and the Katabatic Warm Front to the Right of the Col
CCB Doppler Diagnosis B B C C A A The Beaked Eagle The Headless Eagle • A is the radar site • AB is backing with height indicative of cold advection where really there should be veering with the Ekman Spiral • BC is veering with height indicative of warm advection • B is the front with the mixing layer hidden in the cold advection • This is a strong cold advection • The warm front will be slow moving or stationary • A is the radar site • ABC is all veering with height indicative of warm advection. Layer AB is apt to be partially the result of the Ekman Spiral • BC is veering with height indicative of warm advection • Where is the front and the mixing layer? • The cold advection is not apparent and the warm front will advance
WCB Doppler Diagnosis D A G C B E F H
Behind WCB • Virga much less likely • The CCB has become moist • Frontal overrunning and isentropic lift is maximized thus maximizing the intensity of the precipitation process. • Warm front is likely Anabatic Click for the Conceptual Model and Explanation
B Warm Frontal Cross-section along Trailing Branch of the Warm Conveyor Belt (WCB) A Common location for virga WCB WCB oriented for maximum frontal lift Virga Precipitation Increasing CCB Moistening Lower Hydrometeor Density Mixing Zone Precipitation At Surface Surface Warm Front CCB B A Cold air in Cold Conveyor Belt (CCB) even more shallow and more moist Moist portion of Warm Conveyor Belt (WCB) is thicker, higher and backed from frontal perpendicular – anabatic tendency Lower levels of WCB have the same origin as the upper level of the WCB WCB probably backs slightly with height in spite of the warm air advection. A greater WCB depth is frontal perpendicular Frontal slope likely steeper than the typical 1:200 Precipitation extends further into the moistened, modified CCB. Horizontal rain area expands rapidly as CCB moistened.
C C C C C C WCB DCB CCB DCB Vertical Deformation Zone Distribution and the CBMSummary
C o Warm frontal surface Mixing layer Cold CB Warm CB WCB to the Left of the Col The Warm Left Wing Stoop CM The eagles left wing is folded in as if it is about to swoop down. The right wing is still fully extended to catch the lift of the WCB. Signature of Warm Frontal surface … odd? Signature of Warm Frontal surface Warm advection • Within the CCB: • Probable Ekman spiral nearest surface • Probable cold advection above Ekman spiral Right Wing Left Wing • Within the WCB: • West of radar backing, cold advection • East of radar nil VWS
G D A C B F
WCB Doppler Diagnosis – Diagnosis of the Eagle Wing C C A A D D B B The Left Eagle Wing The Right Eagle Wing • A is the radar site • BC is veering with height indicative of warm advection. • CD is backing with height indicative of cold advection • Larger angles subtended by the arcs BC and CD by the radar site A, are associated with strong thermal advections • A broad wing in the eagle is associated with strong advections • A is the radar site • BC is backing with height indicative of cold advection. • CD is veering with height indicative of warm advection • Larger angles subtended by the arcs BC and CD by the radar site A, are associated with strong thermal advections • A broad wing in the eagle is associated with strong advections
WCB Doppler Diagnosis – Diagnosis on the Gull Wing The Gull Conceptual Model - weaker thermal advections C C A A D D B B The Left Eagle Wing The Right Eagle Wing • A is the radar site • BC is veering with height indicative of warm advection. • CD is backing with height indicative of cold advection • Larger angles subtended by the arcs BC and CD by the radar site A, are associated with strong thermal advections • A narrow wing in the gull is associated with weak advections • A is the radar site • BC is backing with height indicative of cold advection. • CD is veering with height indicative of warm advection • Larger angles subtended by the arcs BC and CD by the radar site A, are associated with strong thermal advections • A narrow wing in the gull is associated with weak advections
Doppler Analysis and Diagnosis Strategies An operational guide to getting the most information from Doppler radar: • Determining the actual wind direction • Determining wind backing and veering • Diagnosing spatial versus vertical wind variations • The Screaming Eagle and Gull Patterns
Diagnosis of the Conveyor Belts • Wind direction and speed diagnosis should be completed independently in each conveyor belt • Given the nature of isentropic flow, this is a prudent mode of diagnosis. Isentropic flows stay relatively separate and maintain their distinctive properties. • The Doppler characteristics depicted in the CCB are separate from those in the WCB. When added, instructive patterns are revealed.
Range Ring versus Radial Zero Velocity Doppler Lines B A B C A C Radial Zero Lines Range Ring Zero Lines • A is the radar site • Zero Doppler Velocity line that follows a radial from the radar like BC depicts velocity vectors that are: • At ever increasing heights • Depictions of vertical speed shear wind differences (no directional shear) • Radial Zero Lines thus depict vertical wind difference/shear • A is the radar site • Zero Doppler Velocity line that follows a range ring like BC depicts velocity vectors that are: • All at the same elevation • Depictions of horizontal wind differences – primarily directional wind shear • Range Ring Zero Lines thus depict spatial wind difference (primarily directional shear) The real Doppler data is a combination of these two patterns
Diagnosis of Wind Direction – Using the Zero Line C • Draw a radial line from the radar site to the zero line • The wind must be either zero or the wind direction must be exactly perpendicular to the radial line • The wind direction can be determined as blowing from the toward colours (blue) to the away colours (red) perpendicular to the radial • Click now Zero Line A B • A is the radar site • BC the zero line • Everywhere along the zero line the radial component of the real wind detected by Doppler must be zero – meaning the total wind must be perpendicular to the radar radial – or actually zero which is unlikely. In Doppler wind analysis always establish the layers where the zero line veers (turns clockwise with range/height) and layers where the zero line backs (turns counterclockwise with range/height. These are the thermal advection layers. The point of inflection between backing and veering separates these important analytical layers.
C D B Diagnosis of Vertical Windshear – Using the Zero line • Determine the wind at B. Draw a radial line from the radar site to the zero line at B. Click • Determine the wind at C. Click • The wind backs from B to C • Determine the wind at D. Click • The wind veers from C to D A Summary - Generalizations • Thermal Advection Intensity • The larger the angle subtended by the arc, the stronger the thermal advections. • The smaller the angle subtended by the arc, the weaker the advections. • This angle is independent of range from the radar • Thermal Advection Type • If the arc rotates cyclonically with height (increasing range) the arc is associated with warm advection. • If the arc rotates anticyclonically with height, the arc is associated with cold advection. Note that the directional wind shear increases with the angle subtended by the arc – This angle does not change with range from the radar (directional shear). The angle subtended by the zero line arc is the directional wind shear component of the velocity vector shear.
C C D B A D B Diagnosis of Vertical Windshear – Using the Zero line A The angle subtended by the counter-clockwise arc BC would be the same regardless of the exact location of C anywhere along the radial AC from the Doppler radar. The amount of backing with height is also independent of the location of C along the radial AC. The amount of wind shear (cold advection) is dependent only on the subtended angle and not the orientation of the arc. The angle subtended by the clockwise arc CD would be the same regardless of the exact location of D anywhere along the radial AD from the Doppler radar. The amount of veering with height is also independent of the location of D along the radial AD. The amount of wind shear (warm advection) is dependent only on the subtended angle and not the orientation of the arc. The thermal VWS is thus the angle subtended by the arc divided by the elevation change that this thermal advection occurred over. The following slide illustrates these concepts.
D D D C A B C A B Thermal Advections and Vertical Wind Shear • The angle subtended by the counter-clockwise arc BC is identical in 1, 2 and 3. • In 1, the backing winds occur over a short radial range and thus a short height interval. • The radial range difference increases for case 2 and is even more for case 3. The height interval for the Thermal VWS increases with the length of the radial AC from case 1 to case 3. • The Thermal VWS determined by dividing the direction shear (subtended angle dependent) by the height interval (difference between AC and AB=AD) that it occurs over, is strongest for 1 and weakest for 3. • As detailed, Thermal VWS is a combination of the size of the subtended angle and the radial range (AC-AB=AD) which when combined, is inversely proportional to the area CBD. • This could feasibly be automatically calculated in URP. I sincerely doubt if it is. C 1. A B 2. 3.
D D D Thermal Advections and Vertical Wind Shear • Which has the strongest Thermal VWS? • The smaller the area CBD, the more intense the Thermal VWS and thus the more intense the thermal advections. C 1. A B • For a given subtended angle: • the strongest Thermal VWS occurs with a Doppler Zero Line closely following the range rings • the weakest Thermal VWS occurs with a Doppler Zero Line closely following the radar radial lines C 2. A B C • Similarly for a given height interval CD radial: • the strongest Thermal VWS occurs with the largest subtended angle • the weakest Thermal VWS occurs with the smallest subtended angle 3. A B
Diagnosis of Stability Trends • Stability increases with: • Cold advection decreasing with height: • Angle of Doppler arc backing counterclockwise decreasing (rate of cooling decreases) with height (range) increasing (Area CBD increasing), • Warm advection increasing with height: • Angle of Doppler arc veering clockwise increasing (rate of warming increases) with height (range) decreasing (Area CBD decreasing), • Warm advection over cold advection: • Doppler arc veering clockwise with height (range) over Doppler arc backing counterclockwise with height (range).
Level C Level C Level C Doppler Examples for Increasing Stability D Level D Weaker cold advection CD Stabilization Stronger cold advection BC C Level B 1. A B Level D Stronger warm advection CD C Stabilization B Weaker warm advection BC Level B 2. A D Level D (Strong) Warm advection CD C Stabilization (Weak) Cold advection BC Level B 3. A D B Note: Angles kept constant. Changing the Thermal Advection Intensity by changing the depth of the directional wind shear.
Diagnosis of Stability Trends • Stability decreases (Destabilization) with: • Cold advection increasing with height: • Angle of Doppler arc backing counterclockwise decreasing (rate of cooling increases) with height (range) • Warm advection decreasing with height: • Doppler arc veering clockwise with height (range) under Doppler arc backing counterclockwise with height (range). • Angle of of Doppler zero arc veering clockwise increasing (rate of warming decreases) with height (range), • Warm advection under cold advection:
Level C Level C Level C Doppler Examples for Increasing Instability D Level D Strongercold advection CD Destabilization C Weakercold advection BC Level B 1. A B D Level D Weaker warm advection BC Destabilization C Stronger warm advection BC Level B 2. A B D Level D (Weak) Cold advection CD Destabilization B C (Strong) Warm advection BC Level B 3. A Note: Angles kept constant. Changing the Thermal Advection Intensity by changing the depth of the directional wind shear.
Changing Stability by Changing the Angle of the Vertical Wind Shear • As the angle subtended by the zero line increases, the amount of directional wind shear also increases. • The directional wind shear must be divided by the height over which this shear occurs in able to determine the magnitude of the thermal advections. • Generally, as the angle increases, so does the thermal advections. The angle of the zero line relative to the range rings is essential to use this technique in an operational setting.
Level C Level C Doppler Examples for Increasing Stability D Level D Weakercold advection CD C Stabilization Strongercold advection BC Level B 1. A B Level D Stronger warm advection CD C Stabilization B Weaker warm advection BC Level B 2. A D Cold Advection Decreasing with Height Stabilization Warm Advection Increasing with Height Stabilization The angles that the zero line makes with the range rings is the operational approach to employ. o o CAA angle increasing with range/height. WAA angle decreasing with range/height. Note: VWS Depth kept constant. Changing the Thermal Advection Intensity by changing the subtended angle (amount) of the directional wind shear. Increasing the angle, decreases the enclosed area.
Level C Level C Doppler Examples for Increasing Instability D Level D Strongercold advection CD Destabilization Weakercold advection BC C Level B 1. A B Level D Weakerwarm advection CD Destabilization B Strongerwarm advection BC Level B 2. A C Cold Advection Increasing with Height Destabilization Warm Advection Decreasing with Height Destabilization D The angles that the zero line makes with the range rings is the operational approach to employ. o o CAA angle decreasing with range/height. WAA angle increasing with range/height. Note: VWS Depth kept constant. Changing the Thermal Advection Intensity by changing the subtended angle (amount) of the directional wind shear. Increasing the angle, decreases the enclosed area.
Doppler Rate of Thermal Advections with Height • Consider the angle between the veering or backing arc and the radar range ring. • If this angle increases (in time) from previous values then the rate of wind shear with height is decreasing, since height is a function of radial range. This must imply that for a given arc, the thermal advections have decreased. • If this angle decreases (in space) along the arc then the rate of wind shear with height is increasing, since height is a function of radial range. This must imply that for a given arc, the thermal advections have increased. • Track the angle the arc makes with the radar rings with both time (between scans) and in space along the trace of the arc… if the angle increases, then the associated thermal advections are decreasing. o
Doppler Rate of Thermal Advections with Height • For example: • A clockwise, veering arc associated with warm advection vertical wind shear: • Indicates that the layer is becoming more stable if the angle with the range rings decreases with range. (warm advection increasing with height) • Indicates that the layer is becoming more unstable if the angle with the range rings increases with range. (warm advection decreasing with height)
Doppler Rate of Thermal Advections with Height • For example: • A counterclockwise, backing arc associated with cold advection vertical wind shear: • Indicates that the layer is becoming more stable if the angle with the range rings increases with range. (cold advection decreasing with height) • Indicates that the layer is becoming more unstable if the angle with the range rings decreases with range. (cold advection increasing with height)
WCB Doppler Diagnosis – Diagnosis of the Eagle Wing C C A A D D B B The Left Eagle Wing The Right Eagle Wing • A is the radar site • BC is veering with height indicative of warm advection. • CD is backing with height indicative of cold advection • Larger angles subtended by the arcs BC and CD by the radar site A, are associated with strong thermal advections • A broad wing in the eagle is associated with strong advections • A is the radar site • BC is backing with height indicative of cold advection. • CD is veering with height indicative of warm advection • Larger angles subtended by the arcs BC and CD by the radar site A, are associated with strong thermal advections • A broad wing in the eagle is associated with strong advections