Download
1 / 67
690 likes | 978 Views
National Church Life Survey 400 000 attenders 7000 local churches 10 000 leaders. More than 22 denominations and movements including:. Anglican Apostolic Assemblies of God Baptist Brethren Catholic Christian Missionary Alliance Christian City Church COC Australia Congregational

E N D
National Church Life Survey 400 000 attenders 7000 local churches 10 000 leaders More than 22 denominations and movements including: Anglican Apostolic Assemblies of God Baptist Brethren Catholic Christian Missionary Alliance Christian City Church COC Australia Congregational CRC Churches International Church of the Nazarene Churches of Christ Four Square Gospel Lutheran Presbyterian Christian Reformed Churches Salvation Army Seventh-day Adventist Uniting Church Vineyard Fellowship Worldwide Church of God and Independent congregations, House churches and other Christian communites. Social Trends in Australia and implications for church life NCLS Research www.ncls.org.au
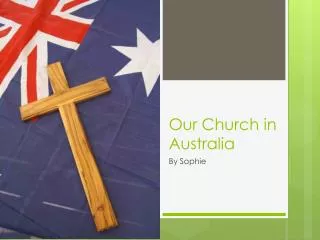
Social Trends in Australia and implications for church life NCLS Research
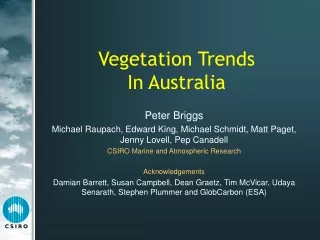
one key trend: Australia’s population is ageing as it is growing
1921 Source: ABS 2008a
1931 Source: ABS 2008a
1941 Source: ABS 2008a
1951 Source: ABS 2008a
1961 Source: ABS 2008a
1971 Source: ABS 2008a
1981 Source: ABS 2008a
1991 Source: ABS 2008a
2001 Source: ABS 2008a
2011 (projected) Source: ABS 2008b
2021 (projected) Source: ABS 2008b
2031 (projected) Source: ABS 2008b
2041 (projected) Source: ABS 2008b
2051 (projected) Source: ABS 2008b
implications • The elderly will make up an increasing proportion of the population • BUT there will still be a numeric increase in the number of children and adults in their middle years
one key trend: Australia’s population is increasingly well educated
education by generation 1896-1926 1927-1946 1947-1966 1967-1986 YOB 2006 age Over 80 60-79 40-59 20-39 “Oldest Generation” “Lucky Generation” “Baby Boomers” “Generation X and Y” ABS label Source: ABS 2009
implications • Increasingly well educated ministry staff will need to be alert to needs of less educated aged congregations • Changing needs and expectations placed on teaching and learning situations from younger generations
one key trend: Australian women are working more
evidence? • 53% of all women 15+ employed in 2006 (up from 40% in 1976) • Small rise in women working full-time (29% up from 26% in 1976) but big rise in part-time employment: 24% of all women work part-time (up from 14% in 1976)
time use by life cycle stage Source: HILDA 2004 via AIFS 2007
time use by life cycle stage Source: HILDA 2004 via AIFS 2007
time use by life cycle stage Source: HILDA 2004 via AIFS 2007
Mums with kids under 5 work an AVERAGE of over 70 hours per week time use by life cycle stage Source: HILDA 2004 via AIFS 2007
implications • Young mums are working really hard • Do you target women as the volunteers with ‘available time’? • Young dads spend lots of time at work • Does church contribute to quality family time?
one key trend: Families are forming and re-forming increasingly flexibly
Only two thirds of all children live in a ‘traditional’ family families with children Source: ABS 2006a
Decline in marriage rates and rise in co-habitation rates • 76% of all marriages in 2006 were preceded by co-habitation • Nearly 40% of all co-habitations begun since 1990 end in separation within 5 years (compared to approx. 9% of marriages in the same period) • Overall decline in the proportion of adults living with a partner • Dramatic increase in ex-nuptial births: 33% of all children in 2006 (up from 3-4% in the 1960s) • BUT proportion of birth certificates with father’s name increased from 58% in 1980 to 90% in 2006 (related to co-habitation) Source: AIFS 2008
implications • Activities will need to be open to non-traditional family structures • Welcoming people with non-traditional families into church will be an increasingly significant social issue • Stable Christian marriages and families can provide valuable support networks and role models
one key trend: New arrivals in your local area are most likely to be from other parts of your state
residential mobility after 5 years At least three of every ten people in our communities has arrived in the last five years from outside the local area. 51% 11% 20% 4% 8% Source: ABS 2006a Not stated: 6%
implications • Opportunities to welcome • Opportunities to provide support and local knowledge
two key trends: There is an increasing diversity of source countries in migration to Australia There has been a massive rise in the number of Australians selecting ‘no religion’ on their Census forms
country of birth 1996 Source: ABS 2008a
country of birth 1997 Source: ABS 2008a