Download
1 / 26
260 likes | 474 Views
Duncan Fyfe Gillies Carlos Thomaz authored the original version of these slides. Ch. 10: Linear Discriminant Analysis (LDA) based on slides from. Modified by Longin Jan Latecki Temple University latecki@temple.edu. The story so far:.

E N D
Duncan Fyfe Gillies Carlos Thomaz authored the original version of these slides Ch. 10: Linear Discriminant Analysis (LDA)based on slides from Modified by Longin Jan Latecki Temple University latecki@temple.edu Intelligent Data Analysis and Probabilistic Inference Lecture 17 Slide No1
The story so far: • Let us start with a data set which we can write as a matrix: • Each column is one data point, each row is a variable, but take care sometimes the transpose is used Intelligent Data Analysis and Probabilistic Inference Lecture 17 Slide No2
The mean adjusted data matrix • We form the mean adjusted data matrix by subtracting the mean of each variable • mi is the mean of the data items in row i Intelligent Data Analysis and Probabilistic Inference Lecture 17 Slide No3
Covariance Matrix • The covariance matrix can be formed from the product: • S = S = (1/(N-1)) U UT Intelligent Data Analysis and Probabilistic Inference Lecture 17 Slide No4
N 1 å T S º = - - S ( x x )( x x ) j j - ( N 1 ) = 1 j Alternative notation for Covariance • Covariance is also expressed in the following way: 1xn row nx1 column Sum over the data points nxn matrix Intelligent Data Analysis and Probabilistic Inference Lecture 17 Slide No5
Projection • A projection is a transformation of data points from one axis system to another. • Finding the mean adjusted data matrix is equivalent to moving the origin to the center of the data. Projection is then carried out by a dot product Intelligent Data Analysis and Probabilistic Inference Lecture 17 Slide No6
Projection Matrix • A full projection is defined by a matrix in which each column is a vector defining the direction of one of the new axes. • F = [ f1, f2, f3, . . . fm ] • Each basis vector has the dimension of the original data space. The projection of data point xi is: • yi = (xi - m)TF Intelligent Data Analysis and Probabilistic Inference Lecture 17 Slide No7
Projecting every point • The projection of the data in mean adjusted form can be written: • UTF = ( FT U )T • Projection of the covariance matrix is • FT S F = FT (1/(N-1)) U UTF • = (1/(N-1)) FT U UTF • which is the covariance matrix of the projected points ( )( ) Intelligent Data Analysis and Probabilistic Inference Lecture 17 Slide No8
Orthogonal and Orthonormal • For most practical cases we expect the projection to be orthogonal • (all the new axes are at right angles to each other) • and orthonormal • (all the basis vectors defining the axes are unit • length) thus: • FT F = I Intelligent Data Analysis and Probabilistic Inference Lecture 17 Slide No9
PCA • The PCA projection is the one that diagonalises the covariance matrix. That is it transforms the points such that they are independent of each other. • FT S F = L • We will look at another projection today called the LDA. Intelligent Data Analysis and Probabilistic Inference Lecture 17 Slide No10
Introduction • Ronald A. Fisher, 1890-1962 • “The elaborate mechanism built on the theory of infinitely large samples is not accurate enough for simple laboratory data. Only by systematically tackling small sample problems on their merits does it seem possible to apply accurate tests to practical data.” • 1936 Intelligent Data Analysis and Probabilistic Inference Lecture 17 Slide No11
Introduction • What is LDA? • Linear Discriminant Analysis, or simply LDA, is a well-known feature extraction technique that has been used successfully in many statistical pattern recognition problems. • LDA is often called Fisher Discriminant Analysis (FDA). Intelligent Data Analysis and Probabilistic Inference Lecture 17 Slide No12
Motivation • The primary purpose of LDA is to separate samples of distinct groups by transforming then to a space which maximises their between-class separability while minimising their within-class variability. • It assumes implicitly that the true covariance matrices of each class are equal because the same within-class scatter matrix is used for all the classes considered. Intelligent Data Analysis and Probabilistic Inference Lecture 17 Slide No13
u f1 f2 x 2 • LDA: u x 1 Geometric Idea x2 • PCA: (f1,f2) x1 Intelligent Data Analysis and Probabilistic Inference Lecture 17 Slide No14
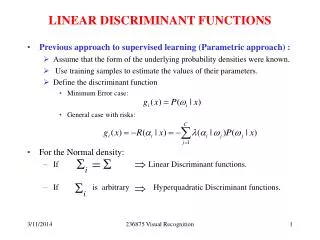
Method • Let the between-class scatter matrix Sb be defined as • and the within-class scatter matrix Sw be defined as • where xi,j is an n-dimensional data point j from class pi, Ni is the number of training examples from class pi, and g is the total number of classes or groups. Intelligent Data Analysis and Probabilistic Inference Lecture 17 Slide No15
Nota Bene • A scatter matrix is un-normalised, using the data matrix formulation: • S = U UT • is a scatter matrix but • Scov = U UT /(N-1) • is the corresponding covariance matrix Intelligent Data Analysis and Probabilistic Inference Lecture 17 Slide No16
Method • The Sw matrix is essentially made up from the pooled estimate of the covariance matrix: • Sw = (N-g) Sp • Since each Si has rank Ni -1 its rank can be at most N-g Intelligent Data Analysis and Probabilistic Inference Lecture 17 Slide No17
Method (cont.) • The sample mean, sample covariance, and grand mean vector are given respectively by: Intelligent Data Analysis and Probabilistic Inference Lecture 17 Slide No18
Method (cont.) • The main objective of LDA is to find a projection matrix Plda that maximises the ratio of the determinant of Sb to the determinant of Sw (Fisher’s criterion), that is
Intuition (cont) • So Fisher’s criterion tries to find the projection that: • Maximises the variance of the class means • Minimises the variance of the individual classes Intelligent Data Analysis and Probabilistic Inference Lecture 17 Slide No20
Intuition • The determinant of the co-variance matrix tells us how much variance a class has. • Consider the co-variance matrix in the PCA (diagonal) projection - the determinant is just the product of the diagonal elements which are the individual variable variances. • The determinant has the same value under any orthonormal projection. Intelligent Data Analysis and Probabilistic Inference Lecture 17 Slide No22
Method (cont.) • It has been shown that Plda is in fact the solution of the following eigensystem problem: • Multiplying both sides by the inverse of Sw Intelligent Data Analysis and Probabilistic Inference Lecture 17 Slide No23
Standard LDA • If Sw is a non-singular matrix then the Fisher’s criterion is maximised when the projection matrix Plda is composed of the eigenvectors of • with at most (g-1) nonzero corresponding eigenvalues. • (since there are only g points to estimate Sb) Intelligent Data Analysis and Probabilistic Inference Lecture 17 Slide No24
Classification Using LDA • The LDA is an axis projection. • Once the projection is found all the data points can be transformed to the new axis system along with the class means and covariances. • Allocation of a new point to a class can be done using a distance measure such as the Mahalanobis distance. Intelligent Data Analysis and Probabilistic Inference Lecture 17 Slide No25
LDA versus PCA • LDA seeks directions that are efficient for discriminating data whereas PCA seeks directions that are efficient for representing data. • The directions that are discarded by PCA might be exactly the directions that are necessary for distinguishing between groups. Intelligent Data Analysis and Probabilistic Inference Lecture 17 Slide No26