Download
1 / 32
340 likes | 554 Views
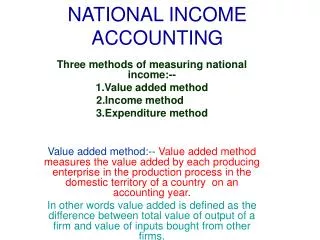
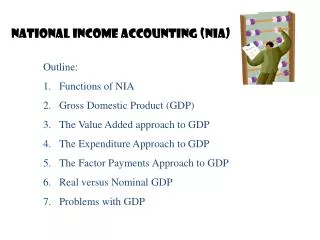
National Income Accounting (NIA). Outline: Functions of NIA Gross Domestic Product (GDP) The Value Added approach to GDP The Expenditure Approach to GDP The Factor Payments Approach to GDP Real versus Nominal GDP Problems with GDP.

E N D
National Income Accounting (NIA) • Outline: • Functions of NIA • Gross Domestic Product (GDP) • The Value Added approach to GDP • The Expenditure Approach to GDP • The Factor Payments Approach to GDP • Real versus Nominal GDP • Problems with GDP
National income accounting (NIA)is the measurement of aggregate or total economic activity. NIA is useful for assessing the performance of the macroeconomy. NIA is also helpful in evaluating the effectiveness of policy initiatives such as the Reagan tax cuts.
Stocks vs. Flows We measure stockvariables at a specific point intime; whereasflows are measuredper unit of time. Flows include: • Income • Sales revenue • Output Stocks include: We measure economicactivity as aflow. • Checking account balance • Balance owed on student loans • Inventories
Gross Domestic Product (GDP) GDPis the market value of new goods and services produced in the economy in one year within the nation’s borders. GDP is our basicmeasure of economicactivity
Three approaches to measuring GDP • The value-addedapproach • The expenditure approach • The factor paymentsapproach
Value-added is the increase in the market value of a good that takes place at each stage of the production -distribution process. Value-Added
Example • Stage 1: Farmer grows wheat, sells it to the Miller for 55 cents. • Stage 2: Miller mills the wheat, sells it to the Baker for 85 cents--hence value-added at the milling stage is 30 cents. • Stage 3: Baker bakes the bread--sells it to the supermarket for $1.45--hence value-added at the baking stage is 60 cents. • Stage 4: Supermarket sells the bread to the consumer for $1.65--hence value added at the retailing stage is 20 cents.
Stages of Production $5.00NotebookPaper $3.50NotebookPaper $2.25NotebookPaper $1.50Raw Paper $1.00Wood Chips Office SuppliesManufacturer Lumber Mill Paper Mill Wholesaler Retailer
Don't double count! To count the notebook in GDP, we count the final transaction only. Otherwise, we would be counting value added twice.
Here we simplyadd up allexpenditures fornew goods and services in oneyear The expenditureapproach GDP = C + I + G + NX Where, Cis personal consumption expenditure;Iis gross private domestic investment;Gis government expenditure (local, state, and federal); andNXis net exports, or Exports minus Imports
Consumption • Household spending for newly-produced goods and services is defined as consumption. We distinguish between 3 categories or types: • Spending for consumer durables • Spending for consumer nondurables • Spending for consumer services.
Consumer Spending by Type, 1999 (in billions) Total spending byU.S. householdsin 1999 was astaggering $6.3trillion Source: Economic Report of the President
What is investment? • All spending by business firms for newly built equipment and business structures. • All changes in business inventories of raw materials, semifinished articles, and finished goods. • All spending by households for newly constructed residential housing
Investment does NOT include • The purchase of stocks, bonds, or other financial assets. • Secondhand sales Remember that investment only happens when there is production of new tangible capital goods
Definitions • Capital consumption allowance (CCA):A monetary measure of the depreciation of the capital stock in a year due to normal wear and tear, fires, or other accidents. • Net Investment: Gross Investment minus CCA. • Indirect business taxes: taxes collected by businesses for government units, such as taxes on entertainment, motels, groceries, liquor, cigarettes, or gasoline taxes. Also called excise taxes. • Net income earned abroad: Income earned by domestic residents in foreign factor markets minus income earned by foreigners in domestic factor markets.
The Factor Payments Approach This mainly involves summing up incomeearned in factor markets GDP = Employee compensation + interest + rent + profits - net income earned abroad + CCA + indirect business taxes
Two Approaches to U.S. GDP, 1999 1Includes the capital consumption allowance and statistical discrepancy Source: Bureau of Economic Analysis (www.bea.gov
Relation of GDP to GNP, NNP, National Income, and Personal Income, 1999 All data in billions of current dollars
From National Income to Personal Income All data in billions of dollars
Personal disposable income (PDI) Personal income $7,792Less: Personal tax payments 1,152Equals: PDI $6,640 PDI is the obviously one measureof ready spending powerof the household sector
Real versus Nominal GDP • We use money to measure the market value of new goods and services produced produced in the economy. • The value (or purchasing power) of money is subject to change over time. • Hence we need to adjust nominal GDP (that is, GDP measured at current prices) for changes in the value of money. • GDP adjusted for changes in the value of money is called real GDP.
Price Quantity = Market Value of Output .50 100 oranges Year 1(base year) $16,350 1.00 300 coconuts 8.00 2,000 pizzas Nominal GDP = Real GDP .50 110 oranges Year 2(quantities increase 10%) $17,985 1.00 330 coconuts 8.00 2,200 pizzas Nominal GDP increases, Real GDP increases
Price Quantity = Market Value of Output .55 100 oranges Year 3(prices increase by 10%) $17,985 1.10 300 coconuts 8.80 2,000 pizzas Nominal GDP increases, Real GDP remains constant
Example Nominal GDP in 1990 is computed by: Goods & ServicesProduced in 1990 (in units) Market Prices in 1990 $5,748.3 billion Nominal GDP in 1991 is computed by: Goods & ServicesProduced in 1991 (in units) Market Prices in 1991 $5,916.7 billion
The problem is this: How do we know if the change in GDP (from ’90 to ’91) is due to a change in actual production of goods and services? That is, the increase in nominal GDP might be explained by an increase in prices.
GDP in the United States (in millions) www.bea.gov
GDP per Person in the United States www.economagic.com
GDP in the U.S. (millions of chained 1996 dollars) Recessions are shaded www.bea.gov Notice that real GDP decreased in 1991
Problems with GDP • GDP does not take full account of qualitative changes in output. • GDP does not take account of the underground economy. • GDP does not account for nonmarket production—that is, goods produced but not sold in the marketplace.