Download

1 / 12
140 likes | 975 Views
Fluorimetry of Quinine. Spectroscopy Lab. Malaria Life Cycle. female Anopheles mosquito. Theory behind Fluorimetry.

E N D
Fluorimetry of Quinine Spectroscopy Lab
Malaria Life Cycle female Anopheles mosquito
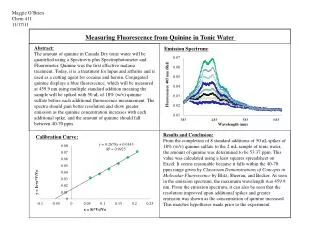
Theory behind Fluorimetry • Light emission from atoms or molecules can be used to quantify the amount of the emitting substance in a sample. The relationship between fluorescence intensity and substance concentration is: F = k * QE * Po * (1-10-ɛ*b*c) Where F is the measured fluorescence intensity, k is a geometric instrumental factor, QE is the quantum efficiency (photons emitted/photons absorbed), Po is the radiant power of the excitation source, ɛ is the wavelength-dependent molar absorptivity coefficient, b is the path length, and c is the concentration (ɛ, b, and c are the same as used in the Beer-Lambert law). Expanding the above equation in a series and dropping higher terms gives: F = k * QE * Po * (2.303 *ɛ * b * c) This relationship is valid at low concentrations (<10-5 M) and shows that fluorescence intensity is linearly proportional to concentration.
Application and Limitations Determining unknown concentrations from the amount of fluorescence that a sample emits requires calibration of a fluorimeter with a standard (to determine K and QE) or by using a working curve . Major Limitations: 1. Many of the limitations of the Beer-Lambert law also affect quantitative fluorimetry. 2. Fluorescence measurements are also susceptible to inner-filter effects. These effects include excessive absorption of the excitation radiation (pre-filter effect) and self-absorption of atomic resonance fluorescence (post-filter effect).
Equipment Description Sample Photomultiplier Mirror Ellipsoid M Source Slit excitation entry Slit emission exit Mirror Mirror Slit Emission entry Slit excitation exit Grating G Mirror Mirror Mirror Reference Photomultiplier Mirror Grating G Beam Splitter Sample
Sample Preparation • Prepare 0.5 liter of 1 molar Sulfuric acid, • Use the 1 Molar sulfuric acid to prepare 1 or 2 liters of 0.1 molar sulfuric acid • Prepare the five standards as described in the lab handout [do not forget to have a blank (0 ppm of quinine in H2SO4) • Prepare at least 100 ml of every solution that is required • Write down in your lab notebook the exact quantity of material you are using to prepare your various solutions. It will help you later on when you will do the analysis of your data if you see some discrepancies.
Experimental Procedure • Start the computer (password: aussie) • Launch the software with the FLDM icon • Turn on the fluorimeter (on/off switch on the left side of the equipment) • Use the .mth first to determine both excitation and emission wavelengths • Perform the prescan with “middle standard” (i.e. 0.05ppm) • Click on the stoplight icon • Box with values show s up when scan is completed
Experimental Procedure • Open conc.MTH method • Under set-up parameters tab, enter in prescan values and change slit widths to 5 • Under Reference tab, click New5 samples • Enter in concentration units (i.e. ppm) once in designated box • Measure background with Blank (i.e 0.1 M H2SO4)
Experimental Procedure • Enter in concentration of each standard prior each run • Click “Measure 1” • Click “yes” when box comes up • Click “Measure 1” again. Repeat through all trials • Under Results tab, click the floppy icon to save the results as .text file
Experimental Procedure • To measure concentration of sample, select Sample tab, click New 1 sample • Click stoplight • Click “yes” to overwrite file • Concentration shows up in dialog box based on linear regression from standards • Save values w/ box • Save as .txt file as in step described previously
Comments • Reliable data will be obtained if: • Samples are carefully prepared, • The quartz cuvette is kept cleaned and rinsed thoroughly with the next test solution, which should be the one of next highest concentration in the serie At the end of the experimental work, (1) ensure that the fluorimeter is shut down, (2) all glassware is cleaned, dried, refilled with 0.1 HCL if necessary and put away, (3) all waste materials have been disposed of in an appropriate and environmentally friendly manner
Useful Links • http://fmrc.pulmcc.washington.edu/DOCUMENTS/FMRC299.pdf • http://omlc.ogi.edu/spectra/PhotochemCAD/html/quinine%280.05M_H2SO4%29.html • http://en.wikipedia.org/wiki/Quinine • http://www.cdc.gov/malaria/about/biology/index.html