Download
1 / 1
10 likes | 114 Views
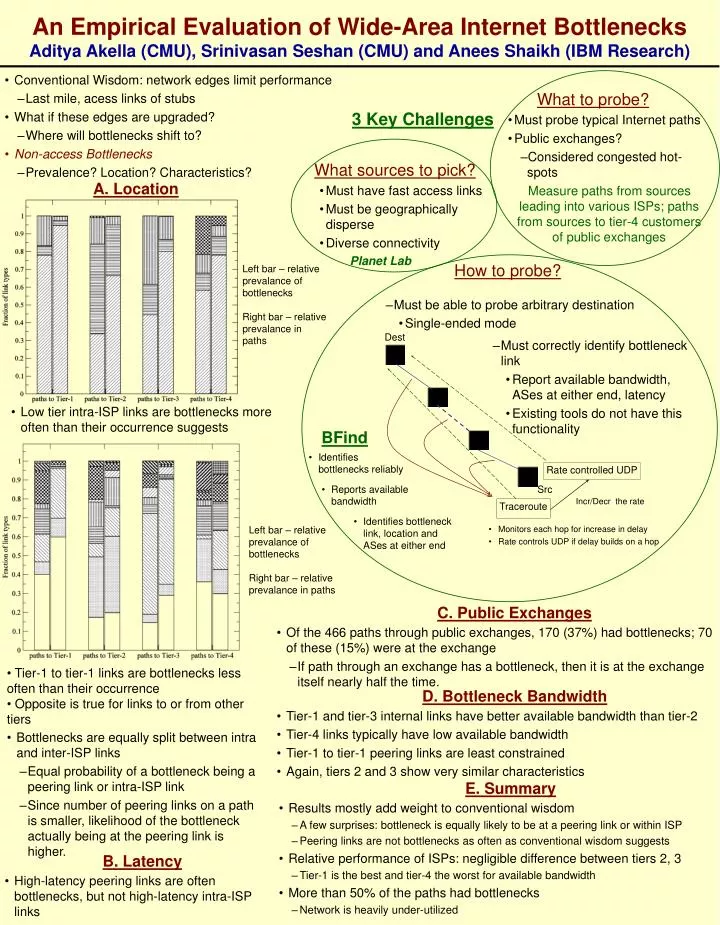
An Empirical Evaluation of Wide-Area Internet Bottlenecks Aditya Akella (CMU), Srinivasan Seshan (CMU) and Anees Shaikh (IBM Research). Conventional Wisdom: network edges limit performance Last mile, acess links of stubs What if these edges are upgraded? Where will bottlenecks shift to?

E N D
An Empirical Evaluation of Wide-Area Internet Bottlenecks Aditya Akella (CMU), Srinivasan Seshan (CMU) and Anees Shaikh (IBM Research) • Conventional Wisdom: network edges limit performance • Last mile, acess links of stubs • What if these edges are upgraded? • Where will bottlenecks shift to? • Non-access Bottlenecks • Prevalence? Location? Characteristics? What to probe? • Must probe typical Internet paths • Public exchanges? • Considered congested hot-spots Measure paths from sources leading into various ISPs; paths from sources to tier-4 customers of public exchanges 3 Key Challenges What sources to pick? • Must have fast access links • Must be geographically disperse • Diverse connectivity Planet Lab A. Location How to probe? Left bar – relative prevalance of bottlenecks Right bar – relative prevalance in paths • Must be able to probe arbitrary destination • Single-ended mode Dest • Must correctly identify bottleneck link • Report available bandwidth, ASes at either end, latency • Existing tools do not have this functionality • Low tier intra-ISP links are bottlenecks more often than their occurrence suggests BFind • Identifies bottlenecks reliably Rate controlled UDP • Reports available bandwidth Src Incr/Decr the rate Traceroute • Identifies bottleneck link, location and ASes at either end Left bar – relative prevalance of bottlenecks Right bar – relative prevalance in paths • Monitors each hop for increase in delay • Rate controls UDP if delay builds on a hop C. Public Exchanges • Of the 466 paths through public exchanges, 170 (37%) had bottlenecks; 70 of these (15%) were at the exchange • If path through an exchange has a bottleneck, then it is at the exchange itself nearly half the time. • Tier-1 to tier-1 links are bottlenecks less often than their occurrence • Opposite is true for links to or from other tiers D. Bottleneck Bandwidth • Tier-1 and tier-3 internal links have better available bandwidth than tier-2 • Tier-4 links typically have low available bandwidth • Tier-1 to tier-1 peering links are least constrained • Again, tiers 2 and 3 show very similar characteristics • Bottlenecks are equally split between intra and inter-ISP links • Equal probability of a bottleneck being a peering link or intra-ISP link • Since number of peering links on a path is smaller, likelihood of the bottleneck actually being at the peering link is higher. E. Summary • Results mostly add weight to conventional wisdom • A few surprises: bottleneck is equally likely to be at a peering link or within ISP • Peering links are not bottlenecks as often as conventional wisdom suggests • Relative performance of ISPs: negligible difference between tiers 2, 3 • Tier-1 is the best and tier-4 the worst for available bandwidth • More than 50% of the paths had bottlenecks • Network is heavily under-utilized B. Latency • High-latency peering links are often bottlenecks, but not high-latency intra-ISP links