Download
1 / 15
150 likes | 354 Views
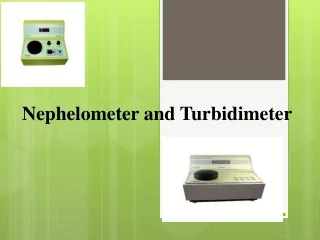
Phoenix Metropolitan Area Urban Nephelometer Program. Mike Sundblom Arizona Department of Environmental Quality April 13, 2005. Network History. Phoenix Urban Haze Program

E N D
Phoenix Metropolitan Area Urban Nephelometer Program Mike Sundblom Arizona Department of Environmental Quality April 13, 2005
Network History • Phoenix Urban Haze Program • Network began in early 1990’s with 1 transmissometer path, 1 nephelometer at JLG Supersite, and a network of Dichotomous Pm10/fine samplers • Expanded in 2003 through a recommendation from the 2000 Governor’s Brown Cloud Summit • Expansion included: • 3 nephelometers • 1 transmissometer path • 4 camera systems • Website – www.phoenixvis.net
Purpose and Use • Track Long Term Visibility Trends in Urban Area • Report Visibility Parameters to the Public (Phoenix area Visibility Index) • AIRNOW Reporting of PM2.5 • PM2.5 Forecasting
AIRNOW Reporting • How does Arizona report nephelometer (Bscat) as PM2.5? • A relation between nephelometer Bsp and PM2.5 reference measurement needed • EPA funded this work in 2003 at two urban locations – Phoenix and Tucson • Work conducted by Battelle (David Wendt and Nancy McMillan)
AIRNOW Reporting • FRM PM2.5 Data • All data is from the Phoenix Supersite • Obtained from AQS • 161 observations during 2002 • Daily from January 1 through March 31 • Every sixth day from April 1 through May 7 • Every third day from May 8 through December 31
AIRNOW Reporting • Dichot data • All data from Phoenix Supersite • Included fine, coarse, and total PM – analysis focused on fine. • 45 Observations during 2002 • February 2 to December 28 • Data only every six days
AIRNOW Reporting • Nephelometer Data • Obtained from IMPROVE website • 2002 Data from Phoenix Supersite • Hourly measurements of Bsp and relative humidity averaged to provide daily observations
AIRNOW Reporting • Individual hourly nephelometer measurements transformed to FRM-like using the equation: Correlation (R)
AIRNOW Reporting January-June 2002 Battelle
AIRNOW Reporting July-December 2002 Battelle
AIRNOW Reporting • Limitations…. • Questions?