Download
1 / 32
320 likes | 687 Views
Budget Analysis for Expenditure Rationalization . Public Finance Analysis and Management Course World Bank, May 1-5, 2006 Marijn Verhoeven Expenditure Policy Division Fiscal Affairs Department, IMF. Overview. Why expenditure rationalization?

E N D
Budget Analysis for Expenditure Rationalization Public Finance Analysis and Management Course World Bank, May 1-5, 2006 Marijn Verhoeven Expenditure Policy Division Fiscal Affairs Department, IMF
Overview • Why expenditure rationalization? • The analytical tool box for expenditure rationalization: • A word about data • Measuring efficiency • We found the problems—now what? (very briefly!)
Why expenditure rationalization? • To achieve macroeconomic stability and fiscal sustainability • To create fiscal space • To increase allocative efficiency by cutting back or reforming government activities • To enhance X-efficiency by achieving the same outputs with less inputs
Why expenditure rationalization? (cont’d) Macroeconomic stability and fiscal sustainability Fiscal space Allocative efficiency X efficiency
The analytical toolbox for expenditure rationalization • Tends to be based on descriptive statistics • Cross-country comparisons and rules-of-thumb are important • Analysis often incorporates institutional elements • Comparatively little use of advanced quantitative techniques
A word about data • Expenditure analysis is typically data driven • But data are problematic • There are many competing sources of spending data, each with their strengths and weaknesses • Let us look at the example of data on wage spending
Facts and figures:measuring wage spending • The wage bill is measured: • As a share of GDP and total spending to compare across countries • As a share of domestic revenue to assess sustainability • At the sectoral level, compare to nonwage spending to assess efficiency • Source is IMF Government Finance Statistics or national data
Lies and statistics: mismeasuring wage spending? • Not all compensation may be captured in wages and salaries: transfers (pension benefits and subventions for education), other goods and services (in-kind benefits and contractual workers), and capital spending (donor-financed projects) may hide substantial wage spending. In Nicaragua, out of actual wage spending of 8.6 percent in 2005, less than 4 percent is recorded as wages and salaries. • When government is decentralized, central government wage spending is biased downward. But reliable data for general government are rare for low-income countries.
Facts and figures:measuring employment • Employment is measured by: • Share of government (or public sector) employment relative to total population, and total/private employment to compare across countries. • The distribution of employment over sectors. • At the sectoral level, the mix of workers with various skills. • Source is World Bank civil service database. • But coverage and accuracy of data is a big problem.
Table 2. Government Employment in the 1990s 1/ Sources: Schiavo-Campo, Salvatore, Giulio de Tommaso and Amitabha Mukherjee (1997), An International Statistical Survey of Government Employment and Wages, Policy Research Paper 1806 (Washington: The World Bank); Hammouya, Messaoud (1999), Statistics on Public Sector Employment, Methodology, Structure and Trends (Geneva: International Labor Office); and OECD (2001), Highlights of Public Sector Pay and Employment Trends (Paris: OECD). 1/ Latest data for 1990s, except for the share of general government employment in population, which is for the early 1990s.
Facts and figures:measuring compensation • Measures for compensation include: • Wage comparisons with the private sector (average or adjusted for skill level) to assess whether government workers are overpaid. A rule of thumb for the discount in public sector wages is 10-30 percent (but treat with caution!). • Compare government wages with GDP per capita provides information on adequacy of government pay in view of living standards (again, be cautious!). If a household survey is available, a more detailed assessment can be made. • The compression ratio compares the highest with the lowest government salary scale. This is used to assess adequacy of wages for the highly skilled. A rule of thumb is that the ratio should be no lower than 12 (yet again, be cautious!). • Data source is often national.
Efficiency: the issue Source: World Bank (2004) World Development Report 2004. Spending refers to total annual public spending per child of primary school age, in 1995 US dollars.
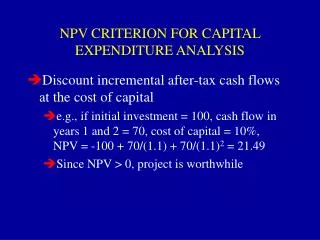
How should we think about the efficiency of public spending? • The measurement of efficiency generally requires the following: • (i) information on inputs and associated costs; • (ii) an estimation of output or benefit; and • (iii) a comparison of (i) and (ii) • Key question: • Could the same level of output be achieved with less input? • Equivalently, could more output be generated with the same level of input?
How should we think about the efficiency of public spending? (cont’d) • What is the mix of public programs that best meets government objectives? • Where to invest the marginal dollar across sectors • For example, can education goals be reached by investing the marginal dollar in other sectors? • Where to invest the marginal dollar within sectors • Primary versus secondary education • Primary health care versus secondary health care
How should we think about the efficiency of public spending? (cont’d) • Given allocative decisions, is output maximized with given inputs? • Common problems: • Inappropriate student/teacher ratios • Shortage of medicine or nurses relative to doctors • Shortage of textbooks • Waste, leakage of funds • Labor and utility costs crowding out maintenance and capital spending
Measuring efficiency • Review the basics of public spending • Functional classification • Primary, secondary, tertiary of education • Primary, secondary, tertiary and higher care (or preventive versus curative care) • Inputs, programs, types of intervention • Education: Teachers, textbooks • Health: Aeral spraying, information and education campaign, etc. • Economic classification • Wage versus non-wage • Recurrent versus capital (investment) spending • Central and local government budgets, other Ministries • Planned versus actual, nominal versus real • [Share of private, NGO, and donor spending]
Measuring efficiency (cont’d) • Benchmarking:simple diagnostics • Some useful descriptive statistics • Budget data • Unit costs • Ratios of teachers, students, non-teaching staff • Distribution of teachers among levels of qualifications; percentage meeting basic government standards • Actual maintenance budget versus engineering estimates for routine maintenance • Enrollment rates, repetition rates, dropout rates • Absenteeism, informal payments, etc.
Measuring efficiency (cont’d) • Benchmarking:simple diagnostics • Comparisons • Sub-national units, clinics, schools • Private versus public schools • Private versus public health facilities • Comparator countries • Cross-country information on output • UNESCO education indicators • Program for International Student Assessment (PISA) • WHO Indicators of Health System Attainment • Trends in International Mathematics and Science Study (TIMSS) • Progress in International Reading Literacy Study (PIRLS). The International Survey of Adults (ISA)
Measuring efficiency (cont’d) • Benchmarking:“Efficiency Frontier” Analysis • Basic idea: measuring distance from the efficiency frontier • Regression analysis • Corrected ordinary least squares (COLS) • Evans et al (2000), WHO (2000): Efficiency of national health systems • Alternative: Greene (2005): Stochastic frontier analysis • Free disposal hull analysis (FDH) • Gupta and Verhoeven (2004) (Chapter 11): Efficiency of health and education spending in 85 countries, 1984-95 • Data envelopment analysis (DEA) • Herrera and Pang (2005): Efficiency of health and education spending in 140 countries, 1996-2002
Efficiency Frontier Analysis: A Brief Overview Output D C Residual E A B Input A Regression Approach
Efficiency Frontier Analysis: A Brief Overview Output D C E A B Input Corrected Ordinary Least Squares (COLS)
Efficiency Frontier Analysis: A Brief Overview Output D C E A B Input FDH Approach
Efficiency Frontier Analysis: A Brief Overview Output D C E A B Input DEA Approach
Measuring efficiency (cont’d) • Randomized evaluations of educational reform programs, based on • Random selection of schools for the reform • Colombian voucher, Angrist and others (2002) • Randomized phase-in of programs • Argentina: Decentralization took place across all provinces, but at different periods and intensities, Galliani and Schargrodsky (2002) • Public Expenditure Tracking Survey • Traces the flow of resources through the bureaucracy from the central government down to the service facility • Comparing originally allocated funds with funds that actually arrive at the facility • Amount of time required for fund to arrive • Reinikka and Svensson (2001): Uganda in the 1990s, significant leakage existed
Example of efficiency analysis using DEA • On-going research on the efficiency of spending in EU New Member States • In the context of an Article IV mission to Slovenia, we made a presentation to the authorities on preliminary results, focusing on Slovenia • We presented findings for education, health, and social protection—I am focusing here only on social protection
Social spending does not efficiently reduce the risk of poverty
Social benefits could be better targeted • Social benefits are either poorly targeted or too small in magnitude to significantly lower income inequality.
What are we missing? • Regarding the mix of public programs • Complexity of policy objectives • Incomplete models/data • Measuring outputs and outcomes • Trade-off between quality and quantity • Feedbacks and externalities • Proper measurement of complementarities • Lagged effects • Externalities: Lower risk of epidemics due to vaccination; healthy, informed electorate • Private versus public provision
Policy reforms for increasing the efficiency of public spending • Expenditure Reform • Input mix, personnel policy (e.g., hiring freeze, reduction in support staff, etc.) • Broad reallocation of expenditure (primary versus secondary education or health) • Management Reform • Decentralization • Community-managed schools, district health management • Financing Reform • Voucher system • [User fees]