Download
1 / 27
270 likes | 366 Views
Learn about mean, median, mode, probability, scatterplots, and mathematical reasoning techniques. Practice problems included.

E N D
CAHSEE PREP. Session 2 Statistics, Data Analysis, Probability And Mathematical Reasoning Chapters 2 and 7 OFL Prep Sessions
Mean, Median, and Mode • Mean – the average of the data Total of the values Number of values • Median – the middle number in a set of data (if there is an even number of data points, find the mean of the middle two points) • Mode – the value that occurs most frequently in a set of data. (It is possible to have a data set with no mode.)
Mean, Median, and Mode The scores on the last science test are as follows: 85, 75, 53, 43, 62, 65, 100, 70, 73, 75, 43, 83, 82, 60, 90, 69 What is the mean score? What is the mode of the data?
Mean, Median, and Mode Find the mean, median, and mode of the following data: 2, 11, 9, 0, 4, 12, 4
Mean, Median, and Mode In their last seven games, the West Oaks basketball team scored 24, 66, 82, 54, 74, 68, and 78 points. What is the median number of points scored?
Scatterplots Several library patrons were surveyed. They were asked how many miles they drove to reach a public library on their last visit and the number of minutes they waited in line to check out books. Would you expect to find a positive correlation, a negative correlation, or no correlation between the number of miles driven and the number of minutes spent in line?
Validity 1) The mean salary for the last five people hired for the J.J. Smith Company was $38,000? 2) The mean salary for the last five people hired for the W.P. Johnson Company was $38,000. 3) When searching for a job, it would make no difference which company you chose to work for since the mean salary for both is $38,000.
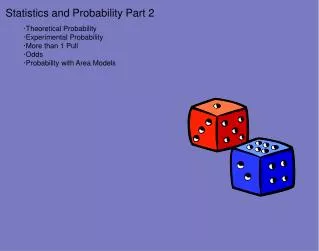
Probability • Probability = the chance that an event will happen • Probability of an independent event = Number of favorable outcomes Number of possible outcomes
Probability A number cube has faces labeled 1 through 6. What is the probability of rolling a 5 on a single roll? What is the probability of not rolling a 5? Express each answer as a fraction, a decimal, and as a percent.
Probability – Compound Events Two bags contain marbles. Each bag has 1 purple and 2 yellow marbles. One marble is pulled from each bag. What is the probability of choosing 2 yellow marbles?
Independent and Dependent Events Michael and April are playing a game with seven cards. The cards are numbered 1 through 7. Michael randomly draws one card and keeps it. Then he randomly picks a second card. What is the probability that the first card is a 5? What is the probability the second card is a 3? Are the events independent or dependent?
Mathematical Reasoning • Now we will continue with a section of Mathematical Reasoning. • Mathematical Reasoning is Chapter 7 in your workbook.
Formulate and Justify Mathematical Conjectures Conjecture: The product of two odd whole numbers and an even whole number is an even whole number. Is this conjecture correct or incorrect?
Use Estimation to Verify Reasonableness of Results According to the U.S. census, the population of San Francisco was 58,802 in 1860. By 1870, the population had grown to 149,873. About how many more people lived in San Francisco in 1870 than in 1860? What was the approximate yearly increase in population over the 10-year period?
Using Patterns to Make Conjectures Use deductive reasoning to explain why the expression -3y + 7 + 5y is equivalent to 2y + 7. Give a reason to justify each step.
Use a Similar Problem to Solve a New Problem There were 6 people in a room. Each person said “Hello” to every other person once. How many “Hello” greetings were exchanged?
HOMEWORK • See Assignment Sheet – Session 2 • Homework is due at the next class meeting or by the assigned date!