Download
1 / 34
340 likes | 512 Views
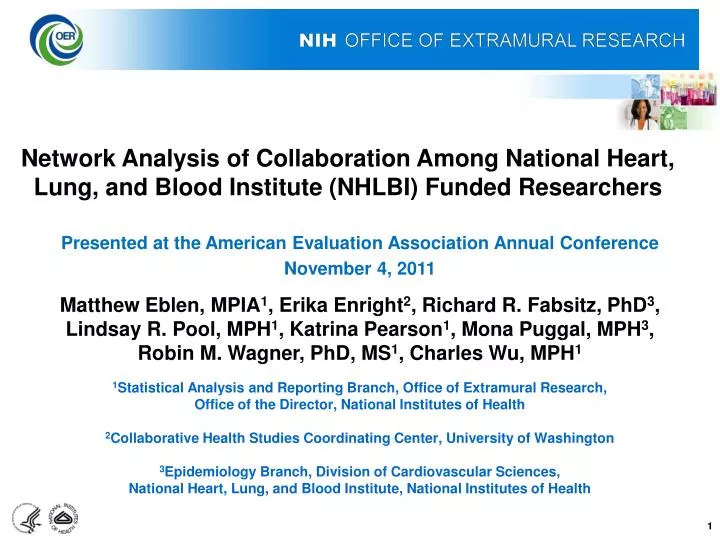
Network Analysis of Collaboration Among National Heart, Lung, and Blood Institute (NHLBI) Funded Researchers. Presented at the American Evaluation Association Annual Conference November 4, 2011 Matthew Eblen, MPIA 1 , Erika Enright 2 , Richard R. Fabsitz, PhD 3 ,

E N D
Network Analysis of Collaboration Among National Heart, Lung, and Blood Institute (NHLBI) Funded Researchers Presented at the American Evaluation Association Annual Conference November 4, 2011 Matthew Eblen, MPIA1, Erika Enright2, Richard R. Fabsitz, PhD3, Lindsay R. Pool, MPH1, Katrina Pearson1, Mona Puggal, MPH3, Robin M. Wagner, PhD, MS1, Charles Wu, MPH1 1Statistical Analysis and Reporting Branch, Office of Extramural Research, Office of the Director, National Institutes of Health 2Collaborative Health Studies Coordinating Center, University of Washington 3Epidemiology Branch, Division of Cardiovascular Sciences, National Heart, Lung, and Blood Institute, National Institutes of Health
Outline • Background on NHLBI-funded Cohort Studies • Strong Heart Study • Cardiovascular Health Study • Research Questions • Methods • Descriptive Statistics • Social Network Analysis • Conclusions • Limitations
Strong Heart Study Background • Strong Heart Study (SHS): Started in 1988 to estimate cardiovascular disease (CVD) mortality and morbidity, and prevalence of known and suspected CVD risk factors in American Indians • Includes 13 American Indian tribes and communities • Phoenix, Arizona • Southwestern Oklahoma • Western and central North and South Dakota • Required participants to be 45-74 years old at entry • Includes questionnaires, clinic exams, laboratory exams, and ongoing surveillance • Strong Heart Family Study launched in 1998, includes family members of original participants to add genetic risk factors • Largest multi-center epidemiologic study of American Indians
Cardiovascular Health Study Background • Cardiovascular Health Study (CHS): Started in 1988 to study development and progression of clinical coronary heart disease (CHD) and stroke in older adults • Persons were recruited at 4 study field sites • Sacramento County, CA • Washington County, MD • Forsyth County, NC • Pittsburgh, PA • Required participants to be 65 years old at entry • Includes questionnaires, clinic exams, ongoing surveillance
Collaboration Resources • Working groups (CHS & SHS) • Both CHS and SHS have committees and working groups focusing on target health topics (such as nutrition, diabetes, genetics, etc.) • Database of Genotypes and Phenotypes (dbGaP) (CHS) • Genomic data is deposited into dbGaP for broad sharing with the research community • Data Analysis Workshops (CHS)* • CHS sponsored workshops for new junior investigators in 2005 and 2007 • Limited Access Data Set (CHS)* • Annually updated de-identified data set which can be distributed easily to any qualified investigator since 2000 *Data available for this analysis
Research Questions Did collaboration increase over time in the co-authorship networks of these two studies? How does the structure of the collaboration networks differ between the two studies? Were the additional resources of the CHS to increase researcher collaboration effective? Are there any researchers who appear to be particularly important agents of collaboration in the network?
Methods • Evaluated journal articles associated with SHS and CHS, and published in 1990 – June 2011 • Publications reported by study coordinating centers, augmented through PubMed searches • Co-author linkages identified • Authors coded as PI, Co-I, or Neither based on their role in study • PI – Funded Principal Investigator • Co-I – Any non-PI paid staff member of study (or NHLBI staff) • Neither – No formal study affiliation • CHS only: Authors attending Data Analysis Workshops or listed on Limited Access Data Set (LADS) papers identified • LADS co-authors don’t have to collaborate with study PI
Methods (cont.) • Traditional descriptive statistics • Compared SHS and CHS publications and authors on summary measures, growth over time, and other characteristics (PI role for authors) • Used SAS 9.2 for statistics and Excel for related graphs • Social network analysis • Compared cumulative growth of the SHS and CHS co-authorship networks over three time periods: 1990-2001, 1990-2006, and 1990-2011 • Used co-authorship as measure of collaboration • Evaluated degrees of collaboration for individual authors and the overall author networks using network statistics • Assessed the impact of CHS activities (LADS and Data Analysis Workshops) on CHS network collaboration • Used R version 2.13.1 statistical software for analysis (statnet and iGraph packages)
Publications Per Year CHS Growth Rate: 4.4 publications per year Average Number of Co-Authors on CHS Publication: 8.5 Average Number of Co-Authors on SHS Publication: 9.0 SHS Growth Rate: 0.9 publications per year 2011 numbers projected, based on publication data as of 6/2011
Year of Entry in CHS Co-Author Pool CHS sponsored workshops for new junior investigators • Limited Access Data Set available
Social Network Statistics Individual Author Statistics
Social Network Statistics (cont.) Overall Network Statistics
Examples – Star and Circle Graphs Author Betweennees Authors: 7 Density: 0.33 Components: 1 Diameter: 3 Network Betweenness: 0.00 Authors: 7 Density: 0.29 Components: 1 Diameter: 2 Network Betweenness: 1.00
Examples (cont.) Authors: 14 Density: 0.44 # Components: 1 Diameter: 3 Network Betweenness: 0.10 Authors: 14 Density: 0.47 # Components: 1 Diameter: 3 Network Betweenness: 0.50 Author Betweenness
SHS vs. CHS, 1990 - 2001 SHS: Authors = 95 Density = 0.13 # Components = 3 Diameter = 3 Betweenness = 0.30 Legend: Red = PI Orange = Co-I Green= Neither CHS: Authors = 342 Density = 0.05 # Components = 6 Diameter = 5 Betweenness = 0.15 Legend: Red = PI Orange = Co-I Green= Neither
SHS vs. CHS, 1990 - 2006 SHS: Authors = 295 Density = 0.18 # Components = 2 Diameter = 4 Betweenness = 0.23 Legend: Red = PI Orange = Co-I Green= Neither CHS: Authors = 692 Density = 0.02 # Components = 15 Diameter = 5 Betweenness = 0.14 Legend: Red = PI Orange = Co-I Green= Neither
SHS vs. CHS, 1990 - 2011 SHS: Authors = 466 Density = 0.09 # Components = 4 Diameter = 4 Betweenness = 0.28 Legend: Red = PI Orange = Co-I Green= Neither CHS: Authors = 1750 Density = 0.02 # Components = 18 Diameter = 5 Betweenness = 0.12 Legend: Red = PI Orange = Co-I Green= Neither
Network Comparison – Controlling for Size SHS 1990 - 2011: Authors = 466 Density = 0.09 # Components = 4 Diameter = 4 Betweenness = 0.28 CHS 1990 - 2003: Authors = 447 Density = 0.04 # Components = 10 Diameter = 4 Betweenness = 0.13
Cut Point Analysis Author Role SHS 1990 – 2011 (n = 466) Legend: Red = PI Orange = Co-I Green= Neither Name = Cut Point
SHS JAMA Meta Paper Influence Legend: Purple = Meta-Paper coauthors (n=115) Brown= Not Meta-Paper coauthors
Effect of Events Designed to Increase Collaboration in CHS Network Legend: Yellow = Ever Had LADS (n=129) Light Green = Attended a Workshop (n=33) Pink = Had LADS and Attended a Workshop (n=1) Blue = Neither Had LADS nor Attended a Workshop (n=1594)
Summary of Network Statistics Features of CHS Network Features of SHS Network More Dense (0.09) Fewer Components (4) Shorter Diameter (4) More Centralized (0.28) Relatively small and compact with a hierarchical structure of collaboration • Less Dense (0.02) • More Components (17) • Longer Diameter (5) • Less Centralized (0.12) • Relatively large and diffuse with a non-hierarchical structure of collaboration
Conclusions • Although CHS had nearly 4 times more publications and unique authors than SHS, they appeared nearly identical on the traditional summary measures of collaboration • Social network analyses permitted greater insights into differences in collaboration between SHS and CHS not obtainable from traditional descriptive analyses • Clearly collaboration increased over time for both networks (including investigators external to the funding award) • The SHS and CHS networks have different structures, highlighting different aspects of collaboration • LADS and Workshops are associated with increased collaboration in the CHS network • Betweenness and cut point analyses reveal that several authors emerge as being especially important collaborators
Limitations • Co-authorship is only one form of collaboration • Investigators may be collaborating in different ways not captured by our method • Strength of collaboration is not considered • Publishing once with a co-author is identical to publishing 10 times with a co-author in our analyses • Our social network statistics are merely descriptive • Statistical models exist (p*, ERGM) that quantify the probability that authors will collaborate, given a certain set of attributes, and controlling for other factors
Acknowledgments A Special Thank You to: Carl McCabe Susan Awad Rediet Berhane Jeannie Olson
Contact Information Robin M. Wagner, PhD, MS Chief Statistical Analysis and Reporting Branch Office of Extramural Research, Office of the Director, NIH Office: 301-443-5234 Email: wagnerr@mail.nih.gov Matthew Eblen, MPIA Mathematical Statistician Statistical Analysis and Reporting Branch Office of Extramural Research, Office of the Director, NIH Office: 301-435-0648 Email: eblenmk@mail.nih.gov
Betweenness Centrality g = the number of nodes Degree of node i = d(ni) gjk(ni) = number of geodesics linking j and k that contain i Betweenness Centrality:
Betweenness Centralization L = number of lines or edges Density: CB(n*) = largest realized actor betweenness for the set of actors Betweenness Centralization:
SHS, 1990 – 2011 (Excluding Big JAMA) SHS: Authors = 466 Density = 0.09 # Components = 4 Diameter = 4 Betweenness = 0.28 SHS: Authors = 372 Density = 0.05 # Components = 5 Diameter = 5 Betweenness = 0.39
Important Authors Legend: Red = PI Orange = Co-I Green= Neither Name = Cut Point
Discussion Questions • What are the barriers to adoption of these new types of tools with respect to: • Learning curve? • Costs ($)? • Perceived utility? • Leadership support? • Should these tools inform or drive decisions for: • Funding agency? • Supported extramural researchers? • Other groups? • Other questions?