Download
1 / 14
140 likes | 290 Views
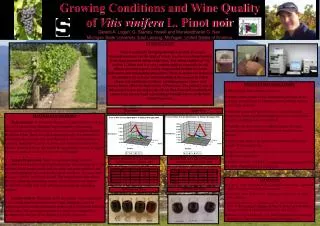
Michal Kříha Supervisor: Ing. David Šebela. THIS PROJECT HAS RECEIVED FINANCIAL SUPPORT FROM THE EUROPEAN SOCIAL FUND AND FROM GOVERNMENT OF THE CZECH REPUBLIC. Changes in the chemical composition of Vitis vinifera during the ripening process. 1. Introduction.

E N D
Michal Kříha Supervisor: Ing. David Šebela THIS PROJECT HAS RECEIVED FINANCIAL SUPPORT FROM THE EUROPEAN SOCIAL FUND AND FROM GOVERNMENT OF THE CZECH REPUBLIC Changes in thechemical composition ofVitisviniferaduring the ripening process.
1. Introduction Changes in the chemical composition of VItis Venifera in time
1. Introduction Phenoliccompounds in vitisvenifera catechin resveratrol quercetin caftaric acid malvidine
Can the phenolic compounds be detected in vivo? Is there a difference between single grapes in the whole cluster? 2. aims
Upper side Middle side Lower side 3. Materialsandmethods 3. 1. Noninvasivemethods
3. Materialsandmethods 3. 2. Noninvasivemethods Reflectance Spectrometer SM 9000 (psi.cz) Anthocyanin indices (Gitelson and Merzlyak, 2001)
We used emission spectra in different excitation wavelenght (230nm, 260nm, 280nm, 305nm, 320nm, 355nm, 390nm, 530nm, 630nm) acoording to absorption maxima of phenolic compounds 3. Materialsandmethods 3. 2. Noninvasivemethods Fluorescence spectrophotometer JobinYvon (horiba.com)
3. Materialsandmethods 3. 3. chemicalanalysis Correctedanthocynanin absorbance AA = A529-(0,288*A650) m = Mw*c (mg/g) c - concentration B - lenghtofcuvette ε - extinctionkoeff. 30.000 (foranthocyanins) Mwofanthocyanins (484,8g/mole) Spectrometer Lambda 35 (perkinelmer.com) (Sims and Gamon, 2002)
Verylowanthocyanincontent in comerciallyavailablevarieties. Eg. CabernetSauvignoncontains 1300mg/kg ofthe sample (Draghiciatal., 2011) 4. Results 4. 1. Estimationofphenoliccompound in vivo (reflectance)
(Exc. 280nm, emission 310nm) (Exc. 320nm, emission 420nm) 4. Results 4. 1. Estimationofphenoliccompound in vivo (Fluorescence) CATECHIN (Flavan 3-ols) CAFTARIC ACID (Hydroxicynnamic acid)
Thebiggestcontentofanth. wasmeasured in redwine. Thebiggestsugarcontentwasdetected in uppersidesoftheclusters. Theywere in the most advancedstateoftheripeningprocess. 4. Results pH Sugar content % Anth. content %
5. Conclusions + Anthocyanin content can be detected in vivo using reflectance parameters. - Limited by the anthocyanin concentration. + Phenolics can be detected in vivo using: (exc. 280nm/em.310nm) Catechin (exc. 320nm/em.420nm) Caftaric acid - Not limited by phenolic compounds concentration. • + Higher sugar content cause was detected in upper sides of the clusters. • We suppose it is because the upper side was in more advanced state of maturity. • We have to verify it because it depends on the position of the whole cluster.
I would like to acknowledge to my project leader David Šebela for everything he helped me with. And I would also like to thank to whole organisation team of Summer schools. Acknowledgements