Download
1 / 8
80 likes | 268 Views
Patient Outcomes. Each patient will be evaluated at up to 4 time points (after 2, 4, 8 and 12 cycles) of therapy.

E N D
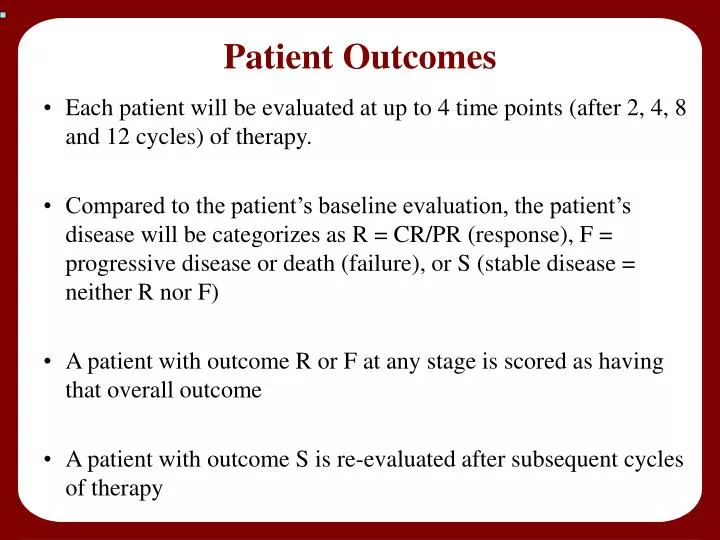
Patient Outcomes Each patient will be evaluated at up to 4 time points (after 2, 4, 8 and 12 cycles) of therapy. Compared to the patient’s baseline evaluation, the patient’s disease will be categorizes as R = CR/PR (response), F = progressive disease or death (failure), or S (stable disease = neither R nor F) A patient with outcome R or F at any stage is scored as having that overall outcome A patient with outcome S is re-evaluated after subsequent cycles of therapy
Evaluation of Response Each patient will be assigned one of the following categories Complete response Partial response Stable disease Progressive disease Early death for malignant disease Early death from toxicity Early death because of other causes Unknown (not assessable insufficient data) • Patients in response categories 4-9 should be considered as failing
Ewings – Current Data Pending patients: 1) S at Eval 1, Pending Eval 2 2) Pending Eval 1
Stopping BoundaryHow close are we in the Ewings subtype? Let denote the overall responserate Accrual will be terminated if Pr( > 0.35 | Data ) < 0.05. That is, there is less than a 5% chance that we have reached the targeted 35% overall response rate Currently with 2 pending patients enrolled Pr( > 0.35 | Data ) = 0.098
Possible Results For Pending Patients By 11/16/2006 both pending patients are scheduled to have scans. Hypothetical outcomes are in maroon.
Pending Patients By 11/16/2006 both pending patients are scheduled to have scans.
Calculating LetpR,jandpS,j denote the probability of R and S at stage j respectively. = pR,1 + pS,1 pR,2 + pS,1 pS,2 pR,3 + pS,1 pS,2pS,3 pR,4 + pS,1 pS,2pS,3 pS,4