Download
1 / 61
610 likes | 629 Views
Explore reliability criteria and probabilistic aspects in power systems for enhanced performance and cost-efficiency. Learn about modern techniques and economic considerations for a robust power network.

E N D
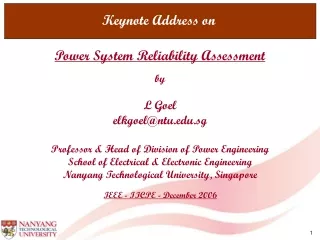
Keynote Address on Power System Reliability Assessment by L Goel elkgoel@ntu.edu.sg Professor & Head of Division of Power Engineering School of Electrical & Electronic Engineering Nanyang Technological University, Singapore IEEE - IICPE - December 2006
Outline • Power System Reliability • Generating System (HLI) Reliability Assessment • Composite System (HLII) Reliability Assessment • Distribution System Reliability Assessment • Cost-Benefit Considerations • Concluding Remarks
Power System Reliability An electric power system serves the basic function of supplying customers, both large and small, with electrical energy as economically and as reliably as possible. The reliability associated with a power system is a measure of its ability to provide an adequate supply of electrical energy for the period of time intended under the operating conditions encountered. Modern society, because of its pattern of social and working habits, has come to expect the power supply to be continuously available on demand - this, however, is not physically possible in reality due to random system failures which are generally outside the control of power system engineers, operators and planners.
Power System Reliability The probability of customers being disconnected can be reduced by increased investment during either the planning phase, operating phase, or both. Over-investment can lead to excessive operating costs which must be reflected in the tariff structure. Consequently, the economic constraints can be violated even though the system may be highly reliable. On the other hand, under-investment can lead to the opposite situation. It is evident therefore that the economic and reliability constraints can be quite competitive, and this can lead to extremely difficult managerial decisions at both the planning and operating phases.
Power System Reliability The criteria and techniques first used in practical applications were basically deterministic (rule-of-thumb) ones, for instance • Planning generating capacity - installed capacity equals the expected maximum demand plus a fixed percentage of the expected maximum demand; • Operating capacity - spinning capacity equals the expected load demand plus a reserve equal to one or more largest units; • Planning network capacity - construct a minimum number of circuits to a load group, the minimum number being dependent on the maximum demand of the group.
Power System Reliability Although the above-mentioned three and other criteria have been developed to account for randomly occurring failures, they are inherently deterministic. The essential weakness of these methods is that they do not account for the probabilistic/stochastic nature of system behavior, customer load demands and/or of component failures. Such aspects can be considered only through probabilistic criteria.
Power System Reliability Typical probabilistic aspects are as follows: • Forced outage rate of generating units is known to be a function of unit size and therefore a fixed percentage reserve cannot ensure a consistent risk; • Failure rates of overhead lines are functions of their lengths, design aspects, locations and environment, etc. - therefore a consistent risk of supply interruption cannot be ensured by constructing a minimum number of circuits; • All planning and operating decisions are based on load forecasting techniques which cannot predict future loads precisely, i.e., uncertainties will always exist in the forecasts. This imposes statistical factors which should be assessed probabilistically.
Power System Reliability It is important to conjecture at this point on what can be done regarding reliability assessment and why it is necessary. Failures of components, plant, and systems occur randomly; the frequency, duration and impact of failures vary from one year to the next. Generally all utilities record details of the events as they occur, and produce a set of performance measures, such as: • system availability • estimated unsupplied energy • number of incidents • number of hours of interruption • excursions beyond set voltage (and frequency) limits
Power System Reliability These performance measures are valuable since: • they identify weak areas needing reinforcements and modifications • they establish chronological trends in reliability performance • they establish existing indices which serve as a guide for acceptable values if future reliability assessments • they enable previous predictions to be compared with actual operating experience • they monitor the response to system design changes The important thing to note is that the above measures are statistical indices - they are not deterministic values.
Adequacy and Security The concept of power system reliability, i.e., the overall ability of the system to satisfy the customer load requirements economically and reliably, is extremely broad. For the sake of simplicity, power system reliability can be divided into the two basic aspects of • system adequacy, and • system security. Adequacy relates to the existence of sufficient facilities within the system to satisfy customer load demands. These include the facilities to generate power, and the associated transmission and distribution facilities required to transport the generated energy to the load points. Adequacy, therefore, relates to static system conditions.
Adequacy and Security Security pertains to the response of the system to the perturbations/disturbances it is subjected to. These may include conditions associated with local and widespread disturbances and loss of major generation/transmission. Most of the techniques presently available are in the domain of adequacy assessment.
Adequacy and Security Power system functional zones Hierarchical levels
Generating System (HLI) Reliability Assessment Generating capacity reliability is defined in terms of the adequacy of the installed generating capacity to meet the system load demand. Outages of generating units and/or load in excess of the estimates could result in “loss of load”, i.e., the available capacity (installed capacity - capacity on outage) being inadequate to supply the load. In general, this condition requires emergency assistance from neighboring systems and emergency operating measures such as system voltage reduction and voluntary load curtailment. Depending on the shortage of the available capacity, load shedding may be initiated as the final measure after the emergency actions. The conventional definition of “loss of load” includes all events resulting in negative capacity margin or the available capacity being less than the load.
Generating System (HLI) Reliability Assessment The basic methodology for evaluating generating system reliability is to develop probability models for capacity on outage and for load demand, and calculate the probability of loss of load by a convolution of the two models. This calculation can be repeated for all the periods (e.g., weeks) in a year considering the changes in the load demand, planned outages of units, and any unit additions or retirements, etc.
Generating System (HLI) Reliability Assessment Probabilistic Criteria and Indices An understanding of the probabilistic criteria and indices used in generating capacity reliability (HLI) studies is important. These include • loss of load probability (LOLP) • loss of load expectation (LOLE) • loss of energy expectation (LOEE)/expected energy not supplied (EENS) • frequency & duration (F&D) indices • energy index of reliability (EIR) • energy index of unreliability (EIU), and • system minutes (SM).
Generating System (HLI) Reliability Assessment LOLP This is the oldest and the most basic probabilistic index. It is defined as the probability that the load will exceed the available generation. Its weakness is that it defines the likelihood of encountering trouble (loss of load) but not the severity; for the same value of LOLP, the degree of trouble may be less than 1 MW or greater than 1000 MW or more. Therefore it cannot recognize the degree of capacity or energy shortage. This index has been superseded by one of the following expected values in most planning applications because LOLP has less physical significance and is difficult to interpret.
Generating System (HLI) Reliability Assessment LOLE This is now the most widely used probabilistic index in deciding future generation capacity. It is generally defined as the average number of days (or hours) on which the daily peak load is expected to exceed the available capacity. It therefore indicates the expected number of days (or hours) for which a load loss or deficiency may occur. This concept implies a physical significance not forthcoming from the LOLP, although the two values are directly related. It has the same weaknesses that exist in the LOLP.
Generating System (HLI) Reliability Assessment LOEE This index is defined as the expected energy not supplied (EENS) due to those occasions when the load exceeds the available generation. It is presently less used than LOLE but is a more appealing index since it encompasses severity of the deficiencies as well as their likelihood. It therefore reflects risk more truly and is likely to gain popularity as power systems become more energy-limited due to reduced prime energy and increased environmental controls.
Generating System (HLI) Reliability Assessment EIR and EIU These are directly related to LOEE which is normalized by dividing by the total energy demanded. This basically ensures that large and small systems can be compared on an equal basis and chronological changes in a system can be tracked.
Generating System (HLI) Reliability Assessment Frequency & Duration (F&D) Indices The F&D criterion is an extension of LOLE and identifies expected frequencies of encountering deficiencies and their expected durations. It therefore contains additional physical characteristics but, although widely documented, is not used in practice. This is due mainly to the need for additional data and greatly increased complexity of the analysis without having any significant effect on the planning decisions.
Composite System (HLII) Reliability Assessment Objective • Composite generating and transmission system evaluation is concerned with the total problem of assessing the ability of the generation and transmission system to supply adequate and suitable electrical energy to the major system load points (Hierarchical level II - HL II) • The problem of calculating reliability indices is equivalent to assessing the expected value of a test function F(x), i.e., : • All basic reliability indices can be represented by this expression, by using suitable definitions of the test function.
Up Down Composite System (HLII) Reliability Assessment Applications in power system planning • Expansion - selection of new generation, transmission, subtransmission configurations; • Operation - selection of operating scenarios; • Maintenance - scheduling of generation and transmission equipment Basic models • G&T Equipment : Markovian or not; Two or multi-states.
Composite System (HLII) Reliability Assessment Basic models • Load : Chronological or not; • Markovian or not; Correlated or not. • System : AC or DC network • representation.
Composite System (HLII) Reliability Assessment Reliability Measures (Conventional) • System indices (sometimes appearing under different names) • LOLP = Loss of load probability • LOLE = Loss of load expectation (h/year) • EPNS = Expected power not supplied (MW) • EENS = Expected energy not supplied (MWh/year) • LOLF = Loss of load frequency (occ./year) • LOLD = Loss of load duration (h) • LOLC = Loss of load cost (US$/year) • etc. • Load point indices • LOLP, LOLE, etc.
Success Healthy Marginal At Risk Composite System (HLII) Reliability Assessment Reliability Measures (Well-Being) • System indices • Prob {H} = Probability of healthy state • Prob {M} = Probability of marginal state • Prob {R} = Probability of at risk state (LOLP) • Freq {H} = Frequency of healthy state (occ./year) • Freq {M} = Frequency of marginal state (occ./year) • Freq {R} = Frequency of at risk state (LOLF) (occ./year) • Dur {H} = Duration of healthy state (h) • Dur {M} = Duration of marginal state (h) • Dur {R} = Duration of at risk state (LOLD) (h) • Load point indices • Prob {H}, Freq {H}, etc.
Composite System (HLII) Reliability Assessment Assessment Tools
Distribution System Reliability Assessment Load Point Indices • failure rate, • average outage time, r • average annual unavailability, U = .r • average load disconnected, L • expected energy not supplied, E = U.L
1 1 0 1 2 2 2 2 1 1 3 2 Distribution System Reliability Assessment State Space (Markov) Model State space diagram for two-component, four-state model
Distribution System Reliability Assessment Series Structure, n Components
Distribution System Reliability Assessment Parallel Structure, n (independent) Components
Distribution System Reliability Assessment System Oriented Reliability Indices, Number of Interruptions • Weighting by number of customers • System Average Interruption Frequency Index : fi = number of interruptions at load point i Ni = number of customers connected to load point i n = number of load points interrupted ntot = total number of load points
Distribution System Reliability Assessment System Oriented Reliability Indices, Annual Interruption Time • Weighting by number of customers • System Average Interruption Duration Index : Ui = firi = annual outage time for load point i ri = Average outage duration for load point i
Distribution System Reliability Assessment System Oriented Reliability Indices, Average Interruption Duration • Weighting by number of customers • Customer Average Interruption Duration Index : SAIFI CAIDI = SAIDI
Distribution System Reliability Assessment System Oriented Reliability Indices, Unavailability, Energy Not Supplied • Average Service Unavailability Index • Energy Not Supplied • Average Energy Not Supplied
Distribution System Reliability Assessment UK System Indices • Security or Customer Interruptions (CIs) • - similar in concept to SAIFI • Availability or Customer Minutes Lost (CMLs) • - similar in concept to SAIDI
Cost-Benefit Considerations • COST of providing quality and continuity of service < should be related to the > • WORTH or BENEFIT of having that quality and continuity
Cost-Benefit Considerations Due to the complex and integrated nature of a power system, failures in any part of the system can cause interruptions which range from inconveniencing a small number of local residents to a major and widespread catastrophic disruption of supply. The economic impact of these outages is not necessarily restricted to loss of revenue by the utility or loss of energy utilization by the customer but, in order to estimate the true costs, should also include indirect costs imposed on customers, society, and the environment due to the outage.
Cost-Benefit Considerations For instance, in the case of the 1977 New York blackout, 84% of the total costs of the blackout were attributed to indirect costs. In order to reduce the frequency and duration of these events, it is necessary to invest either in the design phase, the operating phase, or both. A whole series of questions come to mind: • how much should be spent? • is it worth spending any money? • should the reliability be increased, maintained at existing levels, or allowed to degrade? • who should decide - the utility, a regulator, the customer? • on what basis should the decision be made?
Cost-Benefit Considerations The underlying trend in all these questions is the need to determine the worth of reliability in a power system, who should contribute to this worth, and who should decide the levels of reliability and investment required to achieve them. The basic questions that therefore need to be answered are “Is it worth it?” and “Where or on what should the next dollar be invested in the system to achieve the maximum reliability benefit?”.
Cost-Benefit Considerations The first step in answering the above questions is illustrated in the figure below, which shows how the reliability of a product/system is related to the investment cost, i.e., increased investment is required in order to improve reliability. This clearly shows the general trend that the incremental cost C to achieve a given increase in reliability R increases as the reliability level increases. Alternatively, a given increase in investment produces a decreasing increment in reliability as the reliability is increased. In either case, high reliability is expensive to achieve. Incremental cost of reliability
Cost-Benefit Considerations The incremental cost of reliability, C/R, is one way of deciding whether an investment in the system is worth it. However, it does not adequately reflect the benefits seen by the utility, the customer, or society in general. The two aspects of reliability and economics can be appraised more consistently by comparing reliability cost (investment cost needed to achieve a certain level of reliability) with reliability worth (benefit derived by the customer and society).
Cost-Benefit Considerations The basic concept of reliability cost/reliability worth evaluation is relatively simple and can be presented by the curves of the figure shown below. These curves show that the investment cost generally increases with higher reliability. On the other hand, the customer costs associated with failures decrease as the reliability increases. Utility and customer costs
Cost-Benefit Considerations The total costs are the sum of these two individual costs. This total cost exhibits a minimum, and so an “optimum” or target level of reliability is achieved. Two difficulties usually arise in the total cost assessment. Firstly, the calculated indices are usually derived only from approximate models. Secondly, there are significant problems in assessing customer perceptions of system failure costs.
Cost-Benefit Considerations The disparity between the calculated indices and the monetary costs associated with supply interruptions is shown in the figure. The left hand side of the figure shows the calculated indices at the various hierarchical levels. The right hand side indicates the interruption cost data obtained by user studies. It can be seen that the relative disparity between the calculated indices at the three hierarchical levels and the data available for worth assessment decreases as the consumer load points are approached.
Cost-Benefit Considerations There have been many studies concerning interruption and outage costs. These studies show that, although trends are similar in virtually all cases, the costs vary over a wide range and depend on the country of origin and the type of customer. It is apparent therefore that considerable research still needs to be conducted on the subject of interruption costs. The evaluation of reliability cost through the identification and analysis of criteria and methods used to predict and quantify reliability has progressed significantly during the past two decades. By comparison, the assessment of reliability worth is not as well developed. This is due to the fact that the societal worth of electric service reliability is an extremely complex task.
Cost-Benefit Considerations Broadly speaking, the cost of a power interruption from the customer's perspective is dependent both on the customer and interruption characteristics. Customer characteristics include type of customer, nature of his/her activities/demand requirements. Outage costs will therefore vary substantially between customers within a class, and between classes of customers. Interruption characteristics include the parameters of frequency, duration and magnitude of outage, time of occurrence, time of year, whether partial outage or complete, etc.