Results
10 likes | 207 Views
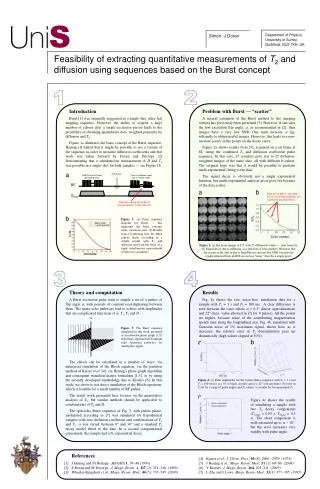
180° pulse. Train of N echoes, read out in reverse order. DANTE train of N low flip-angle pulses. Simon J Doran. RF. G read. Note the decay of the Burst echoes due to T 2 and diffusion. Results

Results
E N D
Presentation Transcript
180° pulse Train of N echoes, read out in reverse order DANTE train of N low flip-angle pulses Simon J Doran RF Gread Note the decay of the Burst echoes due to T2 and diffusion Results Fig. 4a shows the raw, noise-free, simulation data for a sample with T1 = 1 s and T2 = 100 ms. A clear difference is seen between the cases where a = 0.1 (linear approximation) and 22 (max. value allowed in [7] for 9 pulses). All the points are higher, because some of the contributing magnetisation spends time along the longitudinal axis. Fig. 4b, simulated with Gaussian noise of 1% maximum signal, shows how, as a increases, the relative error in T2 determination goes up dramatically (high values clipped at 50%). a b 180 a a a a a a a a a Figure 4: (a) Echo amplitudes for the 9-pulse Burst sequence with T1 = 1 s and T2 = 100 ms for a = 0.1 s (black crosses) and a = 22 (red asterisks); (b) error in T2 fit for a range of pulse angles and T2 values; (c) results for bi-exponential T2. c Figure 4c shows the results of simulating a sample with two T2 decay components (T2short = 0.05 s, T2long = 0.3 s). The short component is well-estimated up to a ~ 10°, but the error increases very rapidly with pulse angle. S Department of Physics, University of Surrey, Guildford, GU2 7XH, UK Feasibility of extracting quantitative measurements of T2 and diffusion using sequences based on the Burst concept Introduction Burst [1] was originally suggested as a single-shot, ultra-fast imaging sequence. However, the ability to acquire a large number of echoes after a single excitation period leads to the possibility of obtaining quantitative data, weighted primarily by diffusion and T2. Figure 1a illustrates the basic concept of the Burst sequence. Hennig [1] hinted that it might be possible to use a variant of the sequence in order to measure diffusion coefficients and this work was taken forward by Doran and Décorps [2] demonstrating that a simultaneous measurement of D and T2 was possible in a single-shot for bulk samples — see Figure 1b. Problem with Burst — “scatter” A natural extension of the Burst method to the imaging context has previously been presented [3]. However, if one uses the low excitation flip angle, a, as recommended in [2], then images have a very low SNR. One must increase a sig-nificantly to obtain useful images. However, this leads to a non-random scatter in the points on the decay curve. Figure 2a shows results from [3], acquired on a rat brain at 8T, using the combined T2 and diffusion coefficient pulse sequence. In this case, 25 a-pulses gave rise to 25 diffusion-weighted images of the same slice, all with different b-values. The original hope was that it would be possible to perform multi-exponential fitting to the data. The signal decay is obviously not a single exponential function, but multi-exponential analysis gives poor fits because of the data scatter. a a b Note the scatter in the data — this is not a SNR problem, but a genuine physical effect. b Figure 1: (a) Pulse sequence diagram for Burst — this represents the basic concept; many variations exist. (b) Results from [2] showing how the Burst echoes decay according to a simple model with T2 and diffusion and form the basis of a rapid, simultaneous measurement of these two quantities. Figure 2: (a) Rat brain images at 8 T, with 25 different b-values — data from [3]. (b) Signal decay due to diffusion, as a function of echo number. We know thatthe scatter in the data is due to Spin Physics and not low SNR, because theresults obtained from an ROI are no less “noisy” than for a single pixel. Theory and computation A Burst excitation pulse train is simply a set of n pulses of flip angle a, with periods of constant read-dephasing between them. The many echo pathways lead to echoes with amplitudes that are complicated functions of a, T1, T2 and D. The effects can be calculated in a number of ways: via numerical simulation of the Bloch equation, via the partition method of Kaiser et al. [4], via Hennig’s phase graph algorithm and consequent transition matrix formalism [1,5], or by using the recently developed methodolgy due to Kiselev [6]. In this work, we chose to use direct simulation of the Bloch equations, which is feasible for a small number of RF pulses. The initial work presented here focuses on the quantitative analysis of T2, but similar methods should be applicable to combinations of T2 and D. The spin-echo Burst sequence of Fig. 3, with pulses phase-modulated according to [7] was simulated for hypothetical samples with zero diffusion coefficient and combinations of T1 and T2. awas varied between 0 and 30 and a standard T2 decay model fitted to the data. In a second computational experiment, the sample had a bi-exponential decay. Figure 3: The Burst sequence simulated for this work, presented as an extended phase graph [1,5]. Solid lines represent the dominant echo formation pathways for small pulse angles. References [1] J Hennig and M Hodapp, MAGMA1, 39–48 (1993) [2] S Doran and M Décorps,, J. Magn. Reson. A, 117 (2), 311–316 (1995) [3] Wheeler-Kingshott et al., Magn. Reson. Med.,44 (5), 737–745 (2000) [4] Kaiser et al., J. Chem. Phys., 60 (8), 2966 –2979 (1974) [5] J Hennig et al., Magn. Reson. Med., 51 (1), 68–80 (2004) [6] V Kiselev, J. Magn. Reson. 164, 205–211 (2003) [7] L Zha and I Lowe, Magn. Reson. Med., 33(3), 377–395 (1995)


