Download
1 / 39
390 likes | 475 Views
Adaptive Integrated Framework (AIF): a new methodology for managing impacts of multiple stressors in coastal ecosystems. Watershed/nutrients/physical forcing. TEAM:. Dimitry Beletsky, Tom Croley, Carlo De Marchi, Joe Depinto, Juli Dyble, Gary Fahnenstiel Tom Johengen,

E N D
Adaptive Integrated Framework (AIF): a new methodology for managing impacts of multiple stressors in coastal ecosystems Watershed/nutrients/physical forcing TEAM: Dimitry Beletsky, Tom Croley, Carlo De Marchi, Joe Depinto, Juli Dyble, Gary Fahnenstiel Tom Johengen, Donna Kashian and Craig Stow
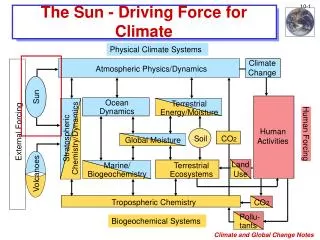
Ecosystem Characterization Ecosystem Stressors • Land & Resource use • Watershed model • Hydrodynamic model • Climate Change • Biophysical data & • processes • Invasive Species Simple statistical Artificial neural network Empirically based (Bayesian) Coupled biophysical 3D models Models Ecosystem (e.g. regression) Socio-economic integration to guide management Recommendations for ecosystem characterization • Experimental • Economic models • Monitoring • Public preference Fish Water quality • Synthesis • Workshops Ecosystem endpoints community & dynamics Human health Adaptive Integrated Framework (AIF): a new methodology for managing impacts of multiple stressors in coastal ecosystems
- Watershed databases • Watershed model • Hydrodynamic model Watershed Nutrient Loading- In Progress Outline Watershed/nutrients/physical forcing Ecosystem Characterization • Biophysical data and processes - Historical sampling sites and dates - Water quality parameters
1991-1996 Saginaw Bay: Study Sites 1991-1992 26 sites (18 inner, 8 outer) 1991-1996 13 sites (8 inner, 5 outer) 1974 - 1980 sampled by EPA & others (Smith et al. 1977) (Bierman et al. 1984)
1991-1996 Saginaw Bay: Sampling Dates LOGISTICS • - Between 6 – 9 cruises/yr • Roughly monthly Apr – Oct • 2-3 days to sample • Three pilot surveys in 1990 • (may give best baseline data)
1991-1996 Saginaw Bay: Parameters Monitored • Physical/Chemical: • CTD profile (w/ Fluorometer and Transmissometer), • pH, Alkalinity, Kpar, Secchi, TSS • Nutrients: • TP, TDP, SRP, NO3, NH4, SiO2, PSiO2, Cl, DOC, POC • Biological: • zooplankton, benthos, phytoplankton, chlorophyll, • primary production, benthic algae and benthic • primary production.
1991-1996 Saginaw Bay: Data Availability • All water qualitly monitoring data available through two NOAA-GLERL Technical Memos: • TM-91, Nalepa et al. 1996 includes data for 1991-1993 • TM-115, Johengen et al. 2000 includes data for 1994 – 1996 Journal of Great Lakes Research: special volume v21 (1995) Bierman et al. (1984) summarizes data from 1974-1980. Data has been extracted from STORET and in our databases
Outline Watershed/nutrients/physical forcing Ecosystem Characterization • Biophysical data and processes - Historical sampling sites and dates - Water quality parameters - Watershed databases • Watershed model • Hydrodynamic model Watershed Nutrient Loading- In Progress
Available Databases for the Saginaw Bay Watersheds • Soil (STATSGO) • DEM • 1992 and 2001 Land use • Hydrography • RUSLE 2 Input parameters • DLBRM Hydrologic input parameters • Nutrient (N & P) loading potential • at county & zip code levels • Atrazine loading potential at county level • Locations of CSOs and SSOs • Water Quality Databases from USGS and EPA . • Point Sources (Factories & MWWTP)
Saginaw Bay Watersheds Surveys Annual Manure 1987, 1992, 1997, 2002 N, P205, K20 Fertilizer 1987, 1992, 1997, 2002 N, P205, K20 Atrazine 80% of all pesticide used in Michigan 2000, 2001, 2002, 2003, 2004 Monthly RUSLE2 parameters topographical factor (slope * slope length) cover factor support practice factor soil erodibility factor 2002 Nitrogen (Manure) Loading
Outline Watershed/nutrients/physical forcing Ecosystem Characterization • Biophysical data and processes - Historical sampling sites and dates - Water quality parameters - Watershed databases • Watershed model • Hydrodynamic model Watershed Nutrient Loading- In Progress
The Distributed Large Basin Runoff Model (DLBRM) • The watershed is subdivided into a grid of square pixels (1 km x 1 km). • Water and pollutants move horizontally according to the difference in elevation between neighboring pixels Flow network Elevation
DLBRM Pixel Water Balance • Physically based • Cascade of storage “tanks” (linear reservoirs) • Degree-day snowmelt • Three soil layers (U, L, G) plus surface water (S) and snow pack • Variable area infiltration • Potential and actual evapotranspiration • Lateral transport from upstream pixels • Model parameters depend on soil characteristics (permeability, etc.) and land use
Spatial Characterization of Saginaw Bay Watersheds (Augres-Rifle, Kawkawlin-Pine, Saginaw, Pigeon-Wiscoggin)
Total Phosphorous Loads for Saginaw River (1989-2005) Have: CSO/SSO Fraction of TP Annual Load to Saginaw Bay • MDEQ • Model predictions
Calibration of the DLBRM Water Quality Simulations Available databases • EPA STORET (www.epa.gov/STORET): The Legacy Data Center contains information prior to 1999 and • The Modernized STORET contains information since 1999. • Permit Compliance System (PCS)- EPA, CSO and SSO – Michigan • EPA NPDES Management System (NMS)- Michigan Department of Environmental Quality • USGS Water Quality Data (http://waterdata.usgs.gov/nwis) Problems: • Sporadic sampling, • Poor temporal and spatial coverage, • Uncertain data quality, • Scarcity of water quality parameters (Suspended sediment concentrations; BOD; E-coli; Total Kjeldahl Nitrogen; Total & Dissolved P, Atrazine) • Uneasy to manipulate data (ASCII and HTML format)
Outline Watershed/nutrients/physical forcing Ecosystem Characterization • Biophysical data and processes - Historical sampling sites and dates - Water quality parameters - Watershed databases • Watershed model • Hydrodynamic model Watershed Nutrient Loading- In Progress
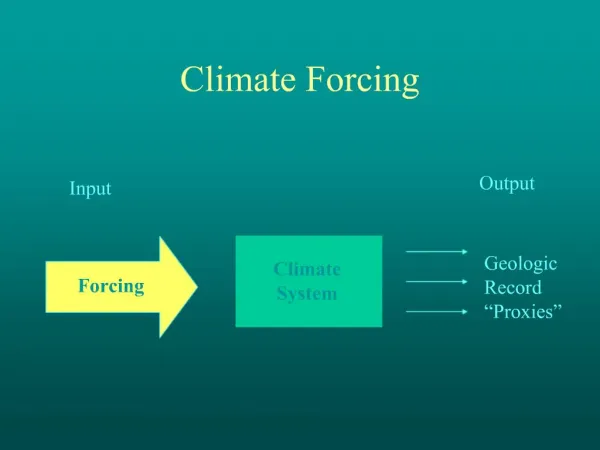
Hydrodynamic models • 3D circulation model (POM) Lake-wide 2 km grid, 20-40 vertical levels Output: 3-D circulation, water temperature, bottom shear stress • 2D wave model (Schwab et al 1984) Output: wave-induced bottom shear stress (to calculate resuspension potential) • 3D particle transport model (Beletsky et al. 2006) Output: particle trajectories, residence time
Hydrodynamic model Input data: NWS land and NDBC buoy meteorological observations
Hydrodynamic model Model years: • 1 Historic year (from 1991-1993), when current observations in Saginaw Bay are available • 3 Field years (2008,2009, and 2010)
Outline Watershed/nutrients/physical forcing Ecosystem Characterization • Biophysical data and processes - Historical sampling sites and dates - Water quality parameters - Watershed databases • Watershed model • Hydrodynamic model Watershed Nutrient Loading- In Progress
Watershed Nutrient LoadingIN PROGRESS • Objectives • provide accurate annual loading of TP, SRP, TN, NO3, TSS for Saginaw River • sample upstream of Saginaw and downstream Bay City to isolate these 2 major urban sources • - Help parameterize sediment and nutrient transport in DLBRM • - event based runoff, high temporal intensity • - focus on confluence of 4 main tributaries: Cass, Flint, Tittabawasse and Shiawassee • - 3-4 events in first couple of years
USGS and MDEQ Water Quality and Discharge Sampling Sites DEQ samples 12 times a year: Low for model calibration Multiple Stressor Plan: 30-40 times (incorporate DEQ sites)
Watershed Nutrient LoadingIN PROGRESS • DEQ Contacts • 1. Christine Aiello • - compiles water quality reports • 2. Jeff Cooper • - runs biological monitoring component • - helping define ‘intensive’ nutrient source study, focusing • on 3 other direct input streams: • USGS Contact • Rick Hubbell • - runs the water quality sampling program for DEQ Helpful for selecting sampling locations to compliment existing monitoring programs and flow gauging sites.
Aquatic Ecosystem ModelsRelate Multiple System Responses to Multiple Stressors Stressors System Responses Algal biomass & Hydrometeorology class composition Toxics Loads AEM Water clarity Nutrient Loads Fish production, biomass and condition Sediment Loads Relative fish species Habitat Changes abundance/harvest Exotic Species Hypolimnetic DO conditions Invasions Fish Harvest Fish body burdens - BCCs Fish Stocking Feedbacks/Homeostasis
Ecosystem Characterization Ecosystem Stressors • Land & Resource use • Watershed model • Hydrodynamic model • Climate Change • Biophysical data & • processes • Invasive Species Simple statistical Artificial neural network Empirically based (Bayesian) Coupled biophysical 3D models Models Ecosystem (e.g. regression) Socio-economic integration to guide management Recommendations for ecosystem characterization • Experimental • Economic models • Monitoring • Public preference Fish Water quality • Synthesis • Workshops Ecosystem endpoints community & dynamics Human health Adaptive Integrated Framework (AIF): a new methodology for managing impacts of multiple stressors in coastal ecosystems
CSO and SSO Events in Saginaw Bay (2000-2004) Michigan Department of Environmental Quality, 2000-2005
Water Quality Characterization of CSOs and SSOs United States Environmental Protection Agency, 2004
Point-Sources CSO’s and SSO’s Point-Sources CSO’s and SSO’s
Field Data to Support Lower Food Web Model DePINTO • Loads and Forcing Functions • Inflows and lake boundary flows • Nutrient (P, N, Si), sediment and organic carbon loads • Solar radiation and wind • In situ measurements • Initial conditions for all model state variables • Time and space observations of model state variables through growing season • Plankton and benthic biomass and group distribution • Nutrient (various forms and species) concentrations • Process Experimentation of Value • P budget and internal cycling • Dreissenid particle filtering and nutrient cycling • Sediment nutrient flux rates • Development of empirical light extinction model on basis of NVSS, Non-algal VSS, Algal VSS, DOM