Download
1 / 20
220 likes | 316 Views
Explore the innovative use of low-dose dual-energy CT for PET attenuation correction through statistically motivated sinogram restoration methods. Discover how these approaches can enhance the accuracy of PET image reconstruction and improve diagnostic outcomes. Simulations and future implications are discussed.

E N D
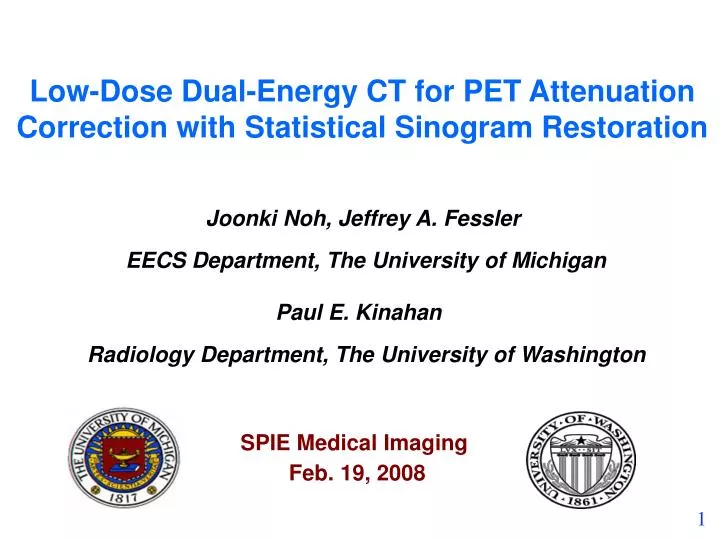
Low-Dose Dual-Energy CT for PET Attenuation Correction with Statistical Sinogram Restoration EECS Department, The University of Michigan Joonki Noh, Jeffrey A. Fessler Paul E. Kinahan Radiology Department, The University of Washington SPIE Medical Imaging Feb. 19, 2008
Outline • Introduction - PET/CT background - CT-based attenuation correction for PET • Conventional sinogram decomposition in DE-CT • Statistically motivated sinogram restoration in DE-CT - Penalized weighted least squares method - Penalized likelihood method • Simulations • Conclusions and future works
Attenuation Needed for PET image reconstruction PET/CT Background I • For the th ray, PET measurement is typically modeled as Spatial distribution of radioisotope activity Linear attenuation coefficient (LAC) PET/CT provides us functional and anatomical information together. • Transmission scans are necessary for PET attenuation correction. For this purpose, the attenuation correction factor (ACF) is defined as follows: Forward projection Evaluated at PET energy • The ACF can be obtained from PET transmission scan or X-ray CT scan.
PET Transmission (511keV) X-ray Transmission (~30-140keV) High noise Low noise Long scan time Short scan time Emission contamination No emission contamination Energy (511keV) matches PET Energies do not match PET PET/CT Background II • Benefits and a challenge of CT-based attenuation correction (CTAC): • Challenge: We need to transform LACs in the range of CT energies (~30–140 keV) to LACs at the PET energy (511keV). However, there is no exact way for this transform.
Conventional CTAC • Conventional method for CTAC is bilinear scaling (with a single-kVp source spectrum) [Blankespoor et al., IEEE TNS, ’94]. • Drawback: ambiguity between bone and non-bone materials with high atomic numbers, e.g., iodine contrast agent. Start from here, in the next slice, we discuss the DE-CT sinogram restoration This may cause biases in ACFs and errors can propagate from ACFs to PET images [Kinahan et al., TCRT, ’06].
Proposed Approaches • We propose two statistically motivated approaches for DE-CT sinogramrestoration, PWLS and PL methods. • Why DE-CT instead of bilinear scaling? [Kinahan et al., TCRT, ’06] To avoid the ambiguity between bone and iodine contrast agent • Why sinogram domain instead of image domain? To compute ACF, we do not have to compute LACs directly. (To avoid potential sources of errors and to reduce computational cost) • Why statistical methods? For low radiation dose, statistical methods yield more accurate ACFs. Therefore DE-CT sinogram restoration is promising for better attenuation corrected PET images !!
where Spatial distribution of the th material density Measurement Model in DE-CT • For the th source spectrum and th ray, sinogram measurement is modeled as a random variable whose mean is Known additive contributions Sinogram Polychromatic measurement source spectrum • LAC can be decomposed with component material basis functions, Mass attenuation coefficient • A simplification gives
Conventional Sinogram Decomposition • By Ignoring measurement noise and inverting the simplified expression for , we have the following estimate of : Sinogram measurement Smoothing in the radial direction Thus, we have a system of nonlinear equations where, e.g., and • Solving nonlinear equations numerically produces the estimates of component sinograms, • This conventional sinogram decomposition involves noise amplifying step and yields very noisy restored component sinograms and reconstructed images with streaks after performing FBP.
Penalized Weighted Least Squares (PWLS) I • To obtain better component sinogram estimates, we use a statistically motivated method. We jointly fit the bone and soft tissue sinograms to the low and high energy log-scans. Roughness penalty function PWLS cost function # of total rays where the sinogram matrix is defined as • The weight matrix (2 x 2 in DECT) are determined based on an approximate variance of . For Poisson distributed measurements and small [Fessler, IEEE TIP, ’96], From this, we define the weight matrix for each ray as follows:
where the regularization parameters ( and ) control resolution/noise tradeoff. Penalized Weighted Least Squares (PWLS) II • The roughness penalty function is defined as Regularization parameter First order difference in the radial direction only • We use the optimization transfer principle to perform PWLS minimization. Using a sequence of separable quadratic surrogates, we arrive at the following equation for update: Due to the non-negativity constraint on sinogram matrix where we precompute the curvature that monotonically decreases the PWLS cost function.
Penalized Likelihood (PL) Approach • PWLS uses the logarithmic transform to obtain , so it is suboptimal in terms of noise. To improve ACFs, we propose a PL approach that is fully based on a statistical model. • Assuming Poisson distributed raw sinogram measurements leads to the PL cost function: Negative Poisson log-likelihood • With the same penalty function as in PWLS, we minimize the PL cost function. • Applying the optimization transfer principle yields where we precompute the curvature that monotonically decreases the PL cost function.
Simulations I • We simulate two incident source spectra with 80kVp and 140kVp: Effective energy To simulate low radiation doses, we use 5 x 10⁴ photons per ray for the 140kVp spectrum. The total number of rays is 140 (radius) x 128 (angle).
Simulations II • NRMS errors obtained from the conventional sinogram decomposition with post smoothing in the radial direction, PWLS decomposition, and PL restoration ACF is defined as Restored component sinogram PET image is reconstructed as follows:
PWLS vs PL For a given iteration number, PL provides lower NRMS error than PWLS.
NRMS error: 12% NRMS error: 21% NRMS error: 13% NRMS error: 30% NRMS error: 56% NRMS error: 34% Restored Component Sinograms Soft Tissue Post-Smoothed Bone
Reconstructed Component CT Images I NRMS error: 54% NRMS error: 31% NRMS error: 33%
Reconstructed Component CT Images II NRMS error: 64% NRMS error: 42% NRMS error: 41%
Reconstructed PET Images with CTAC NRMS error: 33% NRMS error: 19% NRMS error: 18%
Conclusions and Future Works • For low-dose DE-CT, two statistically motivated sinogram restoration methods were proposed for attenuation correction of PET images. • The proposed PWLS and PL methods provided lower NRMS errors than the conventional sinogram decomposition in the sinogram domain, in the image domain, and in terms of ACFs. The PL approach had the lowest NRMS errors. • Future works will include - experiments with real data. - analysis for approximately uniform spatial resolution in sinograms. - comparison with bilinear scaling using iodine contrast agents.