
Uploaded by
ayala
11 SLIDES
234 VIEWS
110LIKES
Interpreting Center Variability
DESCRIPTION
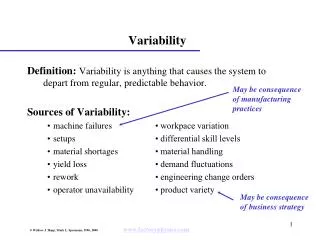
Variability density curves are essential tools for interpreting data distributions. Created by smoothing histograms, these curves are always positioned above the horizontal axis and have an area of exactly one beneath them, ensuring they represent complete data proportions. They describe the likelihood of observations falling within specific value ranges and serve as a comprehensive overview of the overall distribution of data. This approach enhances data visualization and interpretation, making it easier to understand variations and trends in various datasets.
Download
1 / 11
Download Presentation 
Interpreting Center Variability
An Image/Link below is provided (as is) to download presentation
Download Policy: Content on the Website is provided to you AS IS for your information and personal use and may not be sold / licensed / shared on other websites without getting consent from its author.
Content is provided to you AS IS for your information and personal use only.
Download presentation by click this link.
While downloading, if for some reason you are not able to download a presentation, the publisher may have deleted the file from their server.
During download, if you can't get a presentation, the file might be deleted by the publisher.
E N D
Presentation Transcript


More Related