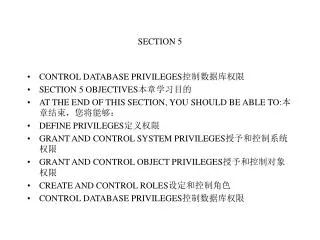
SECTION 5 PLOT CONFIGURATION FILES
SECTION 5 PLOT CONFIGURATION FILES. Plot Configuration Files. This section explains plot configuration files, how to create them, and how to review the results of your analyses. Plot Configuration Files. What’s in this section: Plot Configuration Files Creating Plot Configuration Files

SECTION 5 PLOT CONFIGURATION FILES
E N D
Presentation Transcript
SECTION 5 PLOT CONFIGURATION FILES
Plot Configuration Files • This section explains plot configuration files, how to create them, and how to review the results of your analyses.
Plot Configuration Files • What’s in this section: • Plot Configuration Files • Creating Plot Configuration Files • Creating Plots Using a Plot Configuration File • Format of Plot Configuration Files • Example Plot Configuration File
Plot Configuration Files • Plot configuration files tell your template-based product: • Which plots to create • The vertical and horizontal components that it should plot • General settings and preferences, such as titles, labels, horizontal and vertical spacing's, scaling, legend text, and more • The files currently support only one plot per page, which can contain multiple axes. You can cross-plot multiple analyses of the same type using one plot configuration file. • Plot configuration files are TeimOrbit files and are stored in your database in the plot_configs.tbl directory. • You can access the plot configuration file functionality in Adams/PostProcessor.
Creating Plot Configuration Files • You can create a plot configuration file containing all of the plots currently in Adams/PostProcessor or only a selected set of plots. Your template-based product stores the configuration files in the plot_config table of your default writable database. • Note that you can create only one plot per page.
Creating Plot Configuration Files (Cont.) • To create a plot configuration file: • Create and configure plots as desired, including specifying labels and spacing. For example, you can create a set of plots and add subtitles to all of them that describe the type of analysis with which the plots are associated. • From the File menu, point to Export, and then select Plot Configuration File. The Save Plot Configuration File dialog box appears. • In the Configuration File Name text box, enter the name for the plot configuration. • Select the plots and curves that you want to include. • Select OK.
Creating Plots Using a Plot Configuration File • After you've run an analysis, you can view the series of plots defined in a plot configuration file. If your plot configuration file contains customization command keywords and it has created the plots and curves, you can have your template-based product invoke the macro that contains a command keyword in its user-entered command. • The plot configuration file specifies a subtitle for your plots. In addition, in the File Import • you can: • Add a title to all the plots. • Plot results of multiple analyses on one plot using the Cross Plotting option. • Change the look of your plot, such as fonts and size, using the option Execute Custom Macros. To use this option, you must have a macro that defines the commands to be executed.
Creating Plots Using a Plot Configuration File (Cont.) • To view the plots defined in a plot configuration file: • From the Plot menu, select Create Plots. The File Import dialog box appears. • In the Analyses text box, enter the analysis or analyses from which you want to view results. • In the Plot Configuration File text box, enter the name of the plot configuration file defining the plots that you want to view. • Select OK. • For details, see the Plot tab in the Adams/Car online help.
Format of Plot Configuration Files • Plot Data Block • The plot data block has the following structure: • NAME • SUBTITLE • TIME_LOWER_LIMIT • TIME_UPPER_LIMIT • PLOT_AXES (subblock) • COMMAND • command_keyword • After your template-based product creates each plot, it executes the following commands if you defined a command keyword: acar custom_plots <command_keyword> & plot_name=<plot_name> • The command acar custom_plots <command_keyword> must already be created in the current session, either interactively or already present in the acar.bin, aengine.bin, or arail.bin file. • For more information, see KBA 8848 at: http://support.Adams.com/kb/faq.asp?ID=kb8848.html.
Format of Plot Configuration Files (Cont.) • Plot-Curve Data Block • The plot-curve data block has the following structure: • NAME • PLOT • VERTICAL_AXIS • HORIZONTAL_AXIS • VERTICAL_COMPONENT • HORIZONTAL_COMPONENT • LEGEND_TEXT • COLOR • red, blue, yellow, magenta, cyan, black, white, skyblue, midnight_blue, blue_gray, dark_gray, silver, peach, maize • STYLE • solid, dash, dotdash, dot • SYMBOL • none, x, o, plus, star, at • LINE_WEIGHT • Real value from 1-4 • COMMAND • command_keyword
Format of Plot Configuration Files (Cont.) • After your template-based product creates each curve, it executes the following commands if you defined a command keyword: • The command acar custom_plots <command_keyword> must already be created in the current session, either interactively or already present in the acar.bin, aengine.bin, or arail.bin file. • For more information, see KBA 8848 at: http://support.mscsoftware.com/kb/results_kb.cfm?S_ID=1-KB8848 • We provide several example plot configuration files in the Adams/Car shared database. For details of the output they plot, see KBA 10652 at: http://support.mscsoftware.com/kb/results_kb.cfm?S_ID=1-KB10652
Example Plot Configuration File • The following is an example of an Adams/Car plot configuration file: