Download
1 / 1
10 likes | 33 Views
Axis Direct presents daily derivatives report presenting recommendations based on technical analysis. For trading in derivatives visit https://simplehai.axisdirect.in/offerings/products/derivatives

E N D
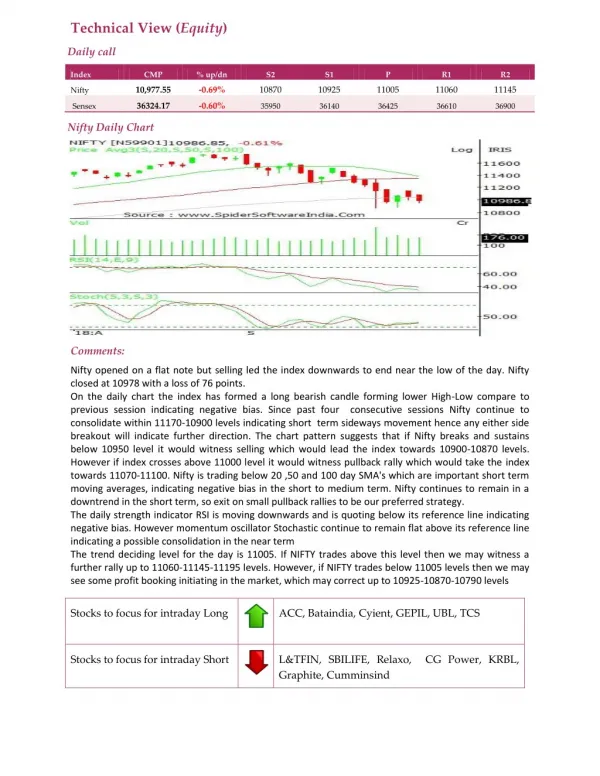
Technical View (Equity) Daily call Index CMP % up/dn S2 S1 P R1 R2 10,977.55 -0.69% 10870 10925 11005 11060 11145 Nifty 36324.17 -0.60% Sensex 35950 36140 36425 36610 36900 Nifty Daily Chart Comments: Nifty opened on a flat note but selling led the index downwards to end near the low of the day. Nifty closed at 10978 with a loss of 76 points. On the daily chart the index has formed a long bearish candle forming lower High-Low compare to previous session indicating negative bias. Since past four consecutive sessions Nifty continue to consolidate within 11170-10900 levels indicating short term sideways movement hence any either side breakout will indicate further direction. The chart pattern suggests that if Nifty breaks and sustains below 10950 level it would witness selling which would lead the index towards 10900-10870 levels. However if index crosses above 11000 level it would witness pullback rally which would take the index towards 11070-11100. Nifty is trading below 20 ,50 and 100 day SMA's which are important short term moving averages, indicating negative bias in the short to medium term. Nifty continues to remain in a downtrend in the short term, so exit on small pullback rallies to be our preferred strategy. The daily strength indicator RSI is moving downwards and is quoting below its reference line indicating negative bias. However momentum oscillator Stochastic continue to remain flat above its reference line indicating a possible consolidation in the near term The trend deciding level for the day is 11005. If NIFTY trades above this level then we may witness a further rally up to 11060-11145-11195 levels. However, if NIFTY trades below 11005 levels then we may see some profit booking initiating in the market, which may correct up to 10925-10870-10790 levels Stocks to focus for intraday Long ACC, Bataindia, Cyient, GEPIL, UBL, TCS Stocks to focus for intraday Short L&TFIN, SBILIFE, Relaxo, CG Power, KRBL, Graphite, Cumminsind