Download
1 / 1
10 likes | 48 Views
Axis Direct presents daily derivatives report presenting recommendations based on technical analysis. For trading in derivatives visit https://simplehai.axisdirect.in/offerings/products/derivatives<br>https://simplehai.axisdirect.in/share-stock-prices/nse/Cipla-Ltd-114<br>https://simplehai.axisdirect.in/share-stock-prices/nse/Wipro-Ltd-614<br>

E N D
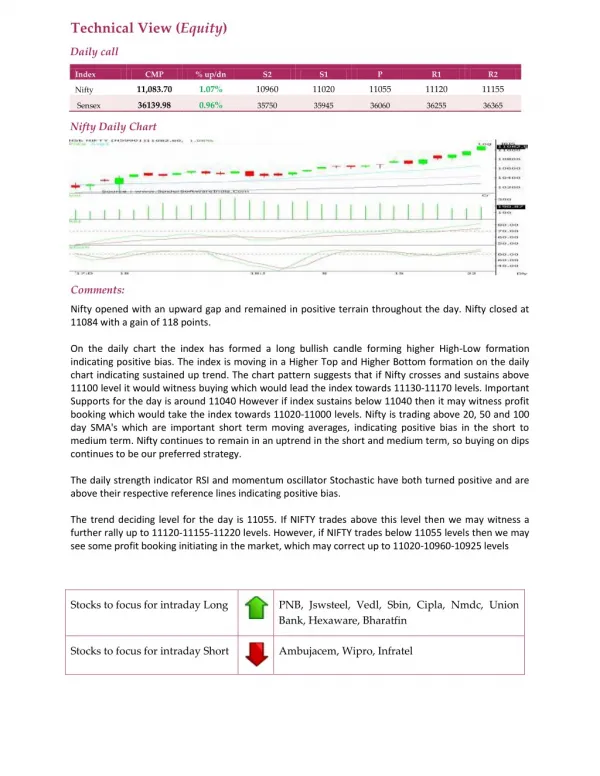
Technical View (Equity) Daily call Index CMP % up/dn S2 S1 P R1 R2 11,083.70 1.07% 10960 11020 11055 11120 11155 Nifty 36139.98 0.96% Sensex 35750 35945 36060 36255 36365 Nifty Daily Chart Comments: Nifty opened with an upward gap and remained in positive terrain throughout the day. Nifty closed at 11084 with a gain of 118 points. On the daily chart the index has formed a long bullish candle forming higher High-Low formation indicating positive bias. The index is moving in a Higher Top and Higher Bottom formation on the daily chart indicating sustained up trend. The chart pattern suggests that if Nifty crosses and sustains above 11100 level it would witness buying which would lead the index towards 11130-11170 levels. Important Supports for the day is around 11040 However if index sustains below 11040 then it may witness profit booking which would take the index towards 11020-11000 levels. Nifty is trading above 20, 50 and 100 day SMA's which are important short term moving averages, indicating positive bias in the short to medium term. Nifty continues to remain in an uptrend in the short and medium term, so buying on dips continues to be our preferred strategy. The daily strength indicator RSI and momentum oscillator Stochastic have both turned positive and are above their respective reference lines indicating positive bias. The trend deciding level for the day is 11055. If NIFTY trades above this level then we may witness a further rally up to 11120-11155-11220 levels. However, if NIFTY trades below 11055 levels then we may see some profit booking initiating in the market, which may correct up to 11020-10960-10925 levels Stocks to focus for intraday Long PNB, Jswsteel, Vedl, Sbin, Cipla, Nmdc, Union Bank, Hexaware, Bharatfin Stocks to focus for intraday Short Ambujacem, Wipro, Infratel


![Full{90k} W.a.t.c.h ("Samson") [2018] Movie {Online Free}"HD"](https://cdn4.slideserve.com/7787773/full-90k-w-a-t-c-h-samson-2018-movie-online-free-dt.jpg)