Download
1 / 1
10 likes | 29 Views
Axis Direct presents daily derivatives report presenting recommendations based on technical analysis. For trading in derivatives visit https://simplehai.axisdirect.in/offerings/products/derivatives<br>https://simplehai.axisdirect.in/share-stock-prices/nse/ICICI-Bank-Ltd-5418<br>https://simplehai.axisdirect.in/share-stock-prices/nse/Asian-Paints-Ltd-34<br>https://simplehai.axisdirect.in/share-stock-prices/nse/Bharat-Petroleum-Corporation-Ltd-2290<br>

E N D
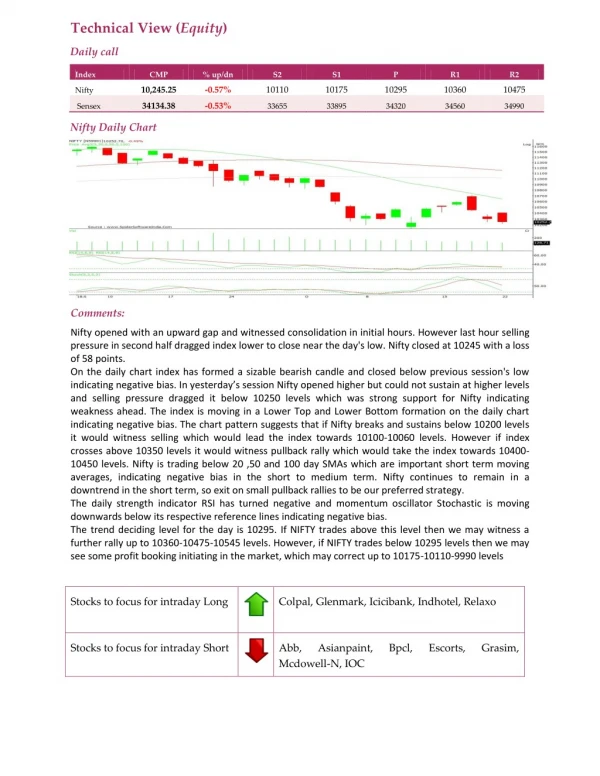
Technical View (Equity) Daily call Index CMP % up/dn S2 S1 P R1 R2 10,245.25 -0.57% 10110 10175 10295 10360 10475 Nifty 34134.38 -0.53% Sensex 33655 33895 34320 34560 34990 Nifty Daily Chart Comments: Nifty opened with an upward gap and witnessed consolidation in initial hours. However last hour selling pressure in second half dragged index lower to close near the day's low. Nifty closed at 10245 with a loss of 58 points. On the daily chart index has formed a sizable bearish candle and closed below previous session's low indicating negative bias. In yesterday’s session Nifty opened higher but could not sustain at higher levels and selling pressure dragged it below 10250 levels which was strong support for Nifty indicating weakness ahead. The index is moving in a Lower Top and Lower Bottom formation on the daily chart indicating negative bias. The chart pattern suggests that if Nifty breaks and sustains below 10200 levels it would witness selling which would lead the index towards 10100-10060 levels. However if index crosses above 10350 levels it would witness pullback rally which would take the index towards 10400- 10450 levels. Nifty is trading below 20 ,50 and 100 day SMAs which are important short term moving averages, indicating negative bias in the short to medium term. Nifty continues to remain in a downtrend in the short term, so exit on small pullback rallies to be our preferred strategy. The daily strength indicator RSI has turned negative and momentum oscillator Stochastic is moving downwards below its respective reference lines indicating negative bias. The trend deciding level for the day is 10295. If NIFTY trades above this level then we may witness a further rally up to 10360-10475-10545 levels. However, if NIFTY trades below 10295 levels then we may see some profit booking initiating in the market, which may correct up to 10175-10110-9990 levels Stocks to focus for intraday Long Colpal, Glenmark, Icicibank, Indhotel, Relaxo Stocks to focus for intraday Short Abb, Mcdowell-N, IOC Asianpaint, Bpcl, Escorts, Grasim,