Download
1 / 1
10 likes | 36 Views
Axis Direct presents daily derivatives report presenting recommendations based on technical analysis. For trading in derivatives visit https://simplehai.axisdirect.in/offerings/products/derivatives<br>https://simplehai.axisdirect.in/share-stock-prices/nse/Cipla-Ltd-114<br>https://simplehai.axisdirect.in/share-stock-prices/nse/Tata-Steel-Ltd-566<br>https://simplehai.axisdirect.in/share-stock-prices/nse/Housing-Development-Finance-Corporation-Ltd-230<br>https://simplehai.axisdirect.in/share-stock-prices/nse/Reliance-Infrastructure-Ltd-88<br>

E N D
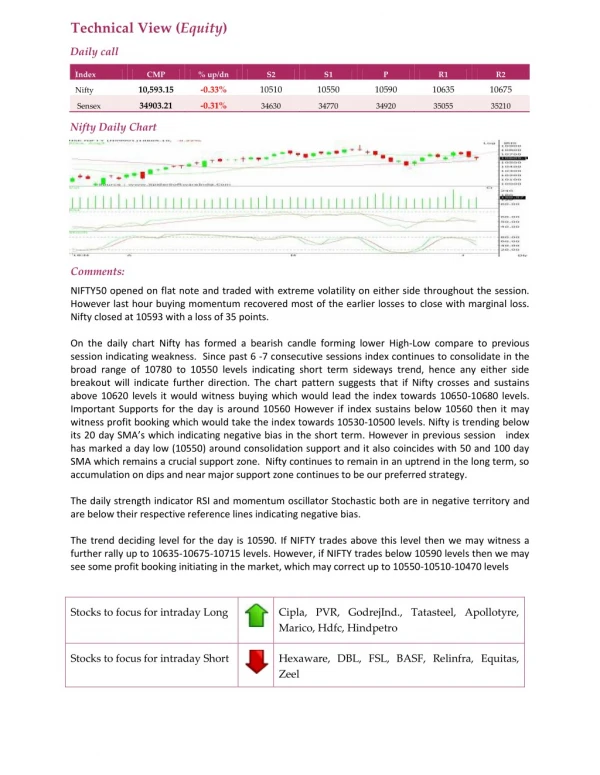
Technical View (Equity) Daily call Index CMP % up/dn S2 S1 P R1 R2 10,593.15 -0.33% 10510 10550 10590 10635 10675 Nifty 34903.21 -0.31% Sensex 34630 34770 34920 35055 35210 Nifty Daily Chart Comments: NIFTY50 opened on flat note and traded with extreme volatility on either side throughout the session. However last hour buying momentum recovered most of the earlier losses to close with marginal loss. Nifty closed at 10593 with a loss of 35 points. On the daily chart Nifty has formed a bearish candle forming lower High-Low compare to previous session indicating weakness. Since past 6 -7 consecutive sessions index continues to consolidate in the broad range of 10780 to 10550 levels indicating short term sideways trend, hence any either side breakout will indicate further direction. The chart pattern suggests that if Nifty crosses and sustains above 10620 levels it would witness buying which would lead the index towards 10650-10680 levels. Important Supports for the day is around 10560 However if index sustains below 10560 then it may witness profit booking which would take the index towards 10530-10500 levels. Nifty is trending below its 20 day SMA’s which indicating negative bias in the short term. However in previous session index has marked a day low (10550) around consolidation support and it also coincides with 50 and 100 day SMA which remains a crucial support zone. Nifty continues to remain in an uptrend in the long term, so accumulation on dips and near major support zone continues to be our preferred strategy. The daily strength indicator RSI and momentum oscillator Stochastic both are in negative territory and are below their respective reference lines indicating negative bias. The trend deciding level for the day is 10590. If NIFTY trades above this level then we may witness a further rally up to 10635-10675-10715 levels. However, if NIFTY trades below 10590 levels then we may see some profit booking initiating in the market, which may correct up to 10550-10510-10470 levels Stocks to focus for intraday Long Cipla, PVR, GodrejInd., Tatasteel, Apollotyre, Marico, Hdfc, Hindpetro Stocks to focus for intraday Short Hexaware, DBL, FSL, BASF, Relinfra, Equitas, Zeel