Download
1 / 21
210 likes | 355 Views
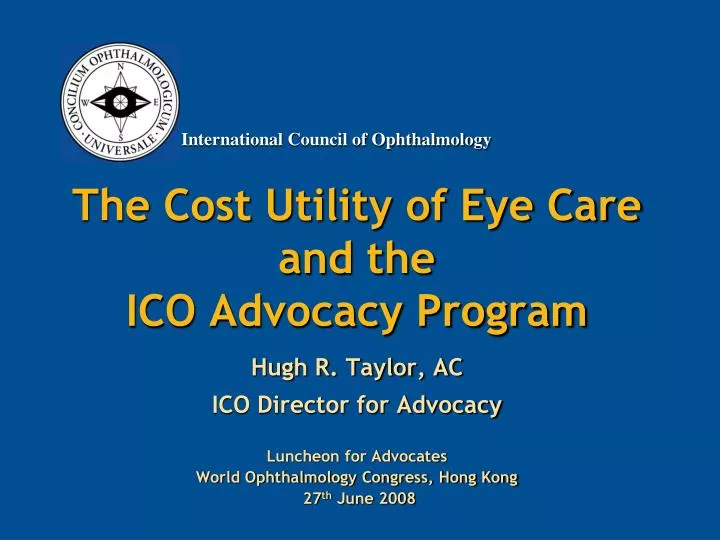
The Cost Utility of Eye Care and the ICO Advocacy Program. Hugh R. Taylor, AC ICO Director for Advocacy Luncheon for Advocates World Ophthalmology Congress, Hong Kong 27 th June 2008. The Extent of the Problem 1.

E N D
The Cost Utility of Eye Care and theICO Advocacy Program Hugh R. Taylor, AC ICO Director for Advocacy Luncheon for AdvocatesWorld Ophthalmology Congress, Hong Kong 27th June 2008
The Extent of the Problem 1 • Worldwide there are 161 million people with vision impairment due to eye disease: • 37 million blind • 124 million with low vision • Plus 153 million with uncorrected refractive error…… Total 314 million people • Burden of blindness greatest in the least developed regions of the globe. • Global vision loss is certain to increase, particularly in developing countries, unless concerted action is taken.
The Extent of the Problem 2 • Government does not give eye care high priority • Eye care competes with every other health issue • Health competes with every other government issue • To be successful you have to talk their language so they will understand you.
40-49 Australia - 2004 Visual Impairment and Blindness 50% Visual Impairment Blindness 40% 30% 20% 10% 0% 50-59 60-69 70-79 80-89 90+ Age
Blindness - 50,000 Australians Refractive Error Others 4% Neuro-ophthalmic 8% Retinitis Pigmentosa 3% 1.5% Macular Degeneration Diabetes and other Retinal 48% 10% 12% Cataract 14% Glaucoma
Vision Impairment – 480,000 AMD Glaucoma 10% 3% Cataract 14% Diabetic Retinopathy 2% 3% 2% Other Retinal 62% 4% Neuro-ophthalmic Refractive Error Other
Years of Life Lost to Disability (YLD) Depression Dementia Asthma Osteoarthritis CHD Type 2 Diabetes Vision disorders Oral health Breast cancer Prostate cancer Melanoma HIV/AIDS 0% 2% 4% 6% 8% YLD as percent of total YLD Clear Insight 2005
Total Costs of Vision DisordersAustralia, 2004 Clear Insight 2004
1. Prevent the diseases we can prevent Appropriately resourced, long-term eye health promotion initiatives to reduce avoidable vision loss
2. Treat the diseases we can treat Adequate funding for eye care services for treatable conditions and for low vision support services
3. More Research A substantial increase in funding for research into causes of vision loss and blindness that at present cannot be prevented or treated
Eye Care Intervention Package Investing in Sight 2005
Australian National Eye Health Framework Key Areas for Action 1. Reducing the risk 2. Increasing early detection 3. Improving access to eye care services 4. Improving the systems and quality of care 5. Improving the evidence base Australian Government 2005
Australian Government Funding • 2006 $14.5 million for eye health promotion • 2006 $920,000 for trachoma $12 million for outreach services • 2008 $45 million for Vision 2020 in Pacific Region
Global Blindness by Cause 1995, 45 million 2002, 37 million
Global Burden Of Disease Perinatal Condition Lower Respiratory Infection Ischaemic Heart Disease Cerebro-Vascular Disease HIV/AIDS Eye Conditions (include DRN) Diarrhoeal Disease Unipolar Depressive Disorders Malaria Ch Obstructive Pulmonary Dis TB Road Traffic Injuries Percentage Chiang et al Lancet 2006
millions Global Blindness 100 90 75 60 50 40 50 38 30 25 25 0 1980 1990 2000 2010 2020
VISION 2020 Partnerships W H O Technical Assistance Capacity Building National Partners - National Vision 2020 Plans Sustainable program delivery
National ophthalmologic societies actively support VISION 2020 in their countries. • Participate in VISION 2020 workshops • National society join the National VISION 2020 Committee. • Presentation at annual Congress about VISION 2020 and how ophthalmologists can help. • Work with the National VISION 2020 Coordinator on: • Including Vision in the “Country Cooperation Strategy” (CCS) • Advocate for more resources for VISION 2020 nationally. • Participate in World Sight Day, 9 October 2009. • Collaborate with the Regional IAPB offices and coordinators on advocacy needs and tools.
Advocacy Messages • Vision loss is common, and increasing • It is the 6th or 7th leading cause of disability • 75% is preventable or curable • Preventing vision loss is very cost effective • The world has agreed on the Vision 2020 goal, “The Right to Sight for All” • Eye care needs to be prioritised and funded • Working in partnership we can achieve this