Download
1 / 37
370 likes | 523 Views
Progress monitoring for social behavior. Cynthia M. Anderson, PhD & Nadia Katul Sampson, MA University of Oregon. School-Wide Positive Behavior Support. Intensive Interventions Specialized Individualized Systems for Students with High-Risk Behavior. ~5%. Targeted Interventions

E N D
Progress monitoring for social behavior Cynthia M. Anderson, PhD & Nadia Katul Sampson, MA University of Oregon
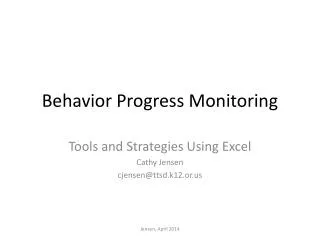
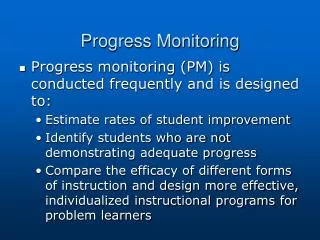
School-Wide Positive Behavior Support Intensive Interventions Specialized Individualized Systems for Students with High-Risk Behavior ~5% Targeted Interventions Specialized Group Systems for Students with At-Risk Behavior Universal Interventions School-/Classroom- Wide Systems for All Students, Staff, & Settings ~15% ~80% of Students
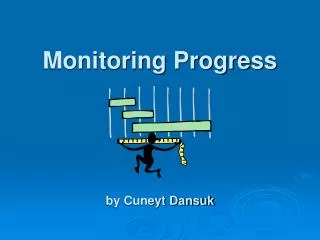
Supporting Staff Behavior Supporting Decision Making Systems OUTCOMES Measurable Outcomes Practices Supporting Student Behavior
Important Outcomes to Monitor • System outcomes • What key features of student support are in place? • Are key features implemented with fidelity? • Individual student outcomes • Decision rules for starting an intervention • “Is this intervention a good fit?” • Progress monitoring during an intervention • “Is the intervention resulting in the outcomes we want?” • Is the intervention being implemented as designed? • “Are we doing what we said we would do?”
Systems Outcomes: Assessing Process • Self Assessment • Monitoring progress over time • Developing an action plan • External Evaluation • Monitoring progress over time • Useful when outside opinion is warranted
Existing Tools for Assessing Process • Universal Component of SWPBS • External • School-wide Evaluation Tool (SET) • Self Assessment • Team implementation Checklist (TIC) • Benchmarks of Quality (BoQ) • Phases of Implementation • Targeted & Intensive Components of SWPBS • External • Individual Student Systems Evaluation Tool (ISSET) • Self Assessment • Benchmarks for Advanced Tiers (BAT)
SYSTEMS Data Practices ISSET and BAT • Key Features • Foundations: What needs to be in place? • Targeted interventions • Intensive interventions • For each feature: • What practices are implemented? • What systems are used? • What outcomes are assessed?
Important Outcomes to Assess • System outcomes • Individual student outcomes • Decision rules for starting an intervention • “Is this intervention a good fit?” • Progress monitoring during an intervention • “Is the intervention resulting in the outcomes we want?” • Is the intervention being implemented as designed? • “Are we doing what we said we would do?”
Important Outcomes to Assess • System outcomes • Individual student outcomes • Decision rules for starting an intervention • “Is this intervention a good fit?”
Is an Intervention a Good Fit? • Questions about the student’s behavior: • What is the problem? • What is the hypothesis about why the problem is occurring • What is the goal of intervention? • Who will be implementing and what are their skills and availability? • Intervention selection: Is this intervention effective for: • Problems like this (severity, intensity, where it occurs, etc.) • Behaviors triggered and maintained by events like this one? • Achieving goals like this? • What resources are needed to implement?
Is this Intervention a Good Fit? • Evaluating outcomes requires planning before the intervention begins • What are the targeted outcomes? • What is the goal—date and outcome? • How will data be collected? • How will data be analyzed? • How often will progress monitoring occur? Group Template Individual Template
Important Outcomes to Assess • System outcomes • Individual student outcomes • Progress monitoring during an intervention • “Is the intervention resulting in the outcomes we want?”
Students in IPBS—Is the Intervention Working? • Once the intervention has begun • Progress monitoring occurs regularly and frequently • Feedback from a teacher(s) • Team feedback • Data are used to guide decision-making • Continue the intervention • Modify the intervention • Begin a new intervention • Fade the existing intervention Behavior Rating Form Behavior Rating & Fidelity Team Feedback Graph System
Important Outcomes to Assess • System outcomes • Individual student outcomes • Is the intervention being implemented as designed? • “Are we doing what we said we would do?”
Fidelity • Documentation that intervention is being implemented as designed • Measurement • Teacher-completed • Assessed by another person
Student Outcomes--Fidelity • What are key components of the intervention? • How can fidelity be measured? • Who will collect and analyze the data? • How will data be used? Sample BSP
Monitoring Student Progress Over Time • System requirements • Efficient • Comprehensive • Easily accessible • Modifiable to meet needs of individual students
Relevant Information for Individual Students • Referral information • Intervention description • Modifications to intervention • Easily interpretable summery of intervention results/progress
Progress-Monitoring in Illinois • Progress monitoring is critical at all levels • Student • Per student, for individual progress-monitoring • In aggregate, to monitor effectiveness of interventions themselves • Ex. Is our ‘problem-solving’ group effective? • Building/District • Per school, to monitor building-level systems • Ex. Is our HS effective at keeping youth engaged? • In aggregate, to make district-level decisions • District as a whole (set goals, allocate resources) • Cohort schools vs non-cohort schools (is an initiative working?)
Data-Based Decision-Making 1) Student outcome data is used: To identify youth in need of support and to identify appropriate intervention For on-going progress-monitoring of response to intervention To exit or transition youth off of interventions 2) Intervention integrity or process data is used: To monitor the effectiveness of the intervention itself To make decisions regarding the continuum/ menu of interventions/supports
Mean CICO points per school 71 Illinois Elementary Schools 08-09 71 Elementary Schools
Secondary Systems Planning Team Meeting Agenda • Number of youth in CICO (record on TT)? • Number of youth responding (record on TT)? * Send Reverse Request for Assistance to teachers of all youth not responding • Number of new youth potentially entering intervention (share # of RFAs, Universal Screening info and/or # of youth who met the data-based decision-rule cut offs for Secondary support)? • Repeat for S/AIG, Mentoring & Brief FBA/BIP • If less than 70% of youth are responding to any of the interventions, the Secondary Systems team should review the integrity of the intervention and make adjustments as needed.
3-Tiered System of Support Necessary Conversations (Teams) UniversalTeam Secondary Systems Team Problem Solving Team Tertiary Systems Team Uses Process data; determines overall intervention effectiveness Uses Process data; determines overall intervention effectiveness Plans SW & Class-wide supports Standing team; uses FBA/BIP process for one youth at a time CICO Universal Support Brief FBA/BIP SAIG Complex FBA/BIP WRAP Group w. individual feature Brief FBA/BIP Sept. 1, 2009
Comparison: Elementary School A FY 2009 CISS Data and IS-SET Data
FY 2009 IS-SET Data Comparison: Elementary School A - District
164 Mean Percentage of Students by Major ODRs 06-07 Elementary School B (677 students)
71 Mean Percentage of Students by Major ODRs 07-08 Elementary School B (707 students)
Mean Percentage of Students by Major ODRs 08-09 Elementary School B (695 students) 61
FY 2009 IS-SET Data Comparison: Elementary School B - District