Download
1 / 28
280 likes | 409 Views
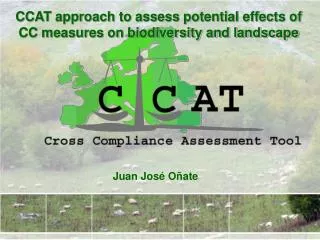
Effects of CC standards on Biodiversity and Landscape Juan J. Oñate & Patricia Martínez (UAM) Brussels, 30 March 2010. Structure. Potential effectiveness assessment Method. Effects of SMRs on biodiversity. Different aggregation levels.

E N D
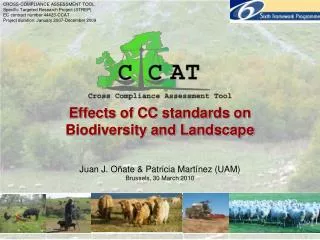
Effects of CC standards on Biodiversity and Landscape Juan J. Oñate & Patricia Martínez (UAM)Brussels, 30 March 2010
Structure Cross Compliance Assessment Tool Potential effectiveness assessment Method. Effects of SMRs on biodiversity. Different aggregation levels. Effects of GAECs on biodiversity. Different aggregation levels. Effects of SMRs on landscape. Effects of GAECs on landscape. Conclusions. Intensity assessment Method. Livestock intensity. Land use intensity. Conclusions. Cross Compliance Assessment Tool
Potential effectiveness - Method Assignment of scores to obligations in the coding database based on the type of impact and potential effectiveness level. Cross Compliance Assessment Tool Cross Compliance Assessment Tool
Potential effectivenessofSMRsonBiodiversity Cross Compliance Assessment Tool Cross Compliance Assessment Tool
Biodiversity - Potential effectiveness - SMRs Cross Compliance Assessment Tool • Strongly varied among regions. • 6 Directives are included: • Birds Directive Highest: Sweden, Scotland, Finland, Germany and some Austrian regions. • Nitrates Directive Highest: Italy and Western France. • Habitat Directive Only important effects in some Austrian regions and Navarra (ES). • Groundwater Directive Low potential effect in most regions (only in Germany it has a higher effect) • Sewage Sludge Directive Highest in Italy and Germany. • Plant Protection Products Directive Low potential effect. • Highest contribution from Birds and Nitrate Directives. Cross Compliance Assessment Tool
Potential effectivenessofBirds Dir.onBiodiversity Cross Compliance Assessment Tool Cross Compliance Assessment Tool
Biodiversity - Potential effectiveness – Birds Dir. Cross Compliance Assessment Tool • Highest effect in Sweden and some Austrian regions. • Lowest in Mediterranean countries • Italy and some Spanish regions have not implemented • 3 measures are included: • Maintain all bird species population High in Sweden, Scotland, Denmark and Austria. Low in Mediterranean countries • Special protection areas Only implemented in Sweden, Spain, England, Northern Ireland and Austria • Prohibit killing/disturbance Generally low potential effect where implemented. • Germany has quite a high score on the three measures. Cross Compliance Assessment Tool
Potential effectiveness ofNitrate Dir.onBiodiversity Cross Compliance Assessment Tool Cross Compliance Assessment Tool
Biodiversity - Potential effectiveness – Nitrate Dir. Cross Compliance Assessment Tool • Highest effect in Italy and western France regions. • Lowest in Spain, Greece, Slovenia, England and Wales. • 11 measures are included: • Most of them with low potential effect or no obligation implemented: Crop specific application; Max 170KgN/ha; Limitations on sloping grounds; Appropriate application techniques; Growing winter crops; Land use management; Fertilizer use recording; Irrigation systems management; NVZ rules. • Periodical no fertiliser Higher effect in Belgium. • Prevent runoff, seepage Higher effect in Finland, Denmark, Germany and Navarra (ES). • Prevent leaching to specific zones Higher effect in western F. • Countries with highest scores, such as France, Germany and Denmark, have implemented obligations related to most measures. Cross Compliance Assessment Tool
Potential effectiveness ofHabitat Dir.onBiodiversity Cross Compliance Assessment Tool Cross Compliance Assessment Tool
Biodiversity - Potential effectiveness – Habitat Dir. Cross Compliance Assessment Tool • Generalized low effect. • Highest in Austrian regions and Navarra (ES). • 2 measures are included: • Special Conservation Areas Important differences between regions. Higher effect in Navarra and Austrian regions. • Preserve plant species in Annex IV Lower in Sweden, Finland, UK, Germany, Netherlands, some Austrian and Spanish regions and Portugal), and slightly higher in Luxembourg, Navarra, La Rioja, Baleares and Salzburg. Cross Compliance Assessment Tool
Potential effectiveness ofGAECsonBiodiversity Cross Compliance Assessment Tool Cross Compliance Assessment Tool
Biodiversity - Potential effectiveness - GAECs. Cross Compliance Assessment Tool • Highest effect in England and some Spanish regions (Cantabria, País Vasco, Cataluña and C. Valenciana). • Lowest in Italy, Slovenia, Hungary, Latvia, Lithuania, Czech Republic and Slovakia. • 5 issues are included: • Soil erosion and Minimum level of maintenance issues have more potential effect on biodiversity than Soil organic matter, Soil structure and the Additional obligations. Cross Compliance Assessment Tool
Biodiversity - Potential effectiveness - GAECs. Cross Compliance Assessment Tool • Main conclusions of GAEC issues: • Overall highest effectiveness from minimum level of maintenance and soil erosion issues • Soil structure and additional farmer’s obligations issues lowest overall effectiveness: • Only Finland, France, England, Wales, Ireland, Belgium, Spain (except Madrid and Murcia), Portugal and Austria have implemented additional obligations. Cross Compliance Assessment Tool
Potential effectivenessof SMRsonLandscape Cross Compliance Assessment Tool Cross Compliance Assessment Tool
Landscape- Potential effectiveness - SMRs. Cross Compliance Assessment Tool • Strongly varied effects among regions. • 6 Directives are included: • Birds Directive: Generally zero or low effect where it has been implemented, except in Austria and Denmark. • Groundwater Directive: Lowand homogeneous across regions (slightly higher in Germany) • Sewage Sludge Directive: Higherin Italy and Germany. • Nitrate Directive: Particularly high in Italy and Western France. • Habitat Directive: Varies strongly among regions. • Plant Protection Products Directive: Low effect / not assessable. Cross Compliance Assessment Tool
Landscape- Potential effectiveness - GAECs. Potential effectivenessof GAECsonLandscape Cross Compliance Assessment Tool Cross Compliance Assessment Tool
Landscape- Potential effectiveness - GAECs. Cross Compliance Assessment Tool • Highest effect in Spain (specially in Cantabria and Comunidad Valenciana) and England. • Lowest in Estonia, Latvia, Lithuania, Italy, Czech Republic, Hungary, Slovakia and Austria. • 5 issues are included: • Soil erosion: Highest in Spain. Not implemented in France, Estonia and Latvia. • Soil organic matter: Highest in Germany. Not implemented in some Italian regions, Denmark, Netherlands and North Ireland. • Soil structure: Highest in Wales (only implemented in UK, Spain, France, Greece, Sweden, Finland, Estonia, Slovenia and Austria). • Minimum level of maintenance: Generally high. Highest in UK, Germany and two Spanish regions (Cantabria and C. Valenciana) • Additional farmers obligations: Highest in England and Wales (only implemented in Spain, Austria, France, Finland, Belgium and UK) Cross Compliance Assessment Tool
Effectiveness assessment.Conclusions. Cross Compliance Assessment Tool Generalized positive potential effects. Effects on biodiversity and landscape of Birds, Habitat, Nitrate and Sewage Sludge Dirs. are highly varied among regions. Effects on biodiversity and landscape of PPP and Groundwater Dirs. are more homogeneous. Effects of GAECs on biodiversity and landscape are highly varied among regions, specially for issues Soil erosion and Minimum level of maintenance. This method, although highly dependent on the scores defined, seems useful to explore patterns of potential effectiveness of CC on biodiversity and landscape in the EU at regional level. Cross Compliance Assessment Tool
Intensity assessment- Method • Changes in intensive and extensive land use and livestock (in absolute and relative figures) per region due to CC measures • Assessment includes: Nitrates, Animal registration, Sewage sludge, Groundwater, Plant Protection Products, Food Law and Calves, Pigs and Animal welfare Directives. • Post model calculation using the output of CAPRI model. • Different scenarios are assessed by the CCAT tool: 2005 baseline year, 0%, 25%, 50%, 75% and 100% compliance, and 50% gap closure. Cross Compliance Assessment Tool Cross Compliance Assessment Tool
Intensity assessment- Method • Livestock intensity • Indicator: Share of LU in a NUTS2 region classified as extensive or intensive according to a combination of two indexes: Stocking density (SD) and Concentrate feed and maize consumption (CFM). • Calculation: • Pigs and poultry automatically included in the intensive group. • Classification of ruminant animal types, combining two indexes: • Stocking density adding up all LU of dairy, other cattle, sheep and goats, and dividing this number by the fodder area. • Concentrated feed index relative share of energy intake per type of ruminant, estimated to come from concentrate feed and maize. • Combination of classes of the three input-related indexes: Cross Compliance Assessment Tool Cross Compliance Assessment Tool
% Change in share of extensive & intensive livestock: Compliance gap 0-100% Extensive Intensive Cross Compliance Assessment Tool Cross Compliance Assessment Tool
Intensity assessment - Share of extensive / intensive livestock Cross Compliance Assessment Tool Cross Compliance Assessment Tool Extensive • Extensification is higher in Estonia, regions in North Germany and Belgium, Slovakia, Greece and Northwest Iberian Peninsula regions. • Intensification is higher in some regions in Poland, Czech Republic, Austria, Greece, Italy and Navarra. Intensive • Extensification is higher in Estonia, Latvia, Lithuania, some regions in Poland, Greece, Slovakia, France, Portugal and Spain. • Intensification is higher in Wales, País Vasco and some regions in Belgium, Hungary and Finland.
Intensity assessment- Method • Land use intensity • Indicator: Regional UAA classified as extensive/medium/intensive, (share or absolute ha) according to an indicator that combines 1) organic N application, 2) mineral N application, and 3) crop protection products spending (CPS) for the main crops in the region. • Calculation: Integration of the 3 indexes into 1 combined indicator • Sum of N-organic and N-mineral kilograms. • Classification of the combined N index and the CPS index in 3 intensity classes (30% below and upper threshold values of the EU weighted average limits). • Combination of classess of the three input-related indexes Cross Compliance Assessment Tool Cross Compliance Assessment Tool
% Change in share of land use Intensive Compliance gap between 0 and 100% Relative differences Extensive Medium Cross Compliance Assessment Tool Cross Compliance Assessment Tool
Intensity assessment - Share of extensive, medium and intensive land uses. Cross Compliance Assessment Tool General decrease in % of intensive UAA, mainly in the Mediterranean countries and East European countries and some regions in Central Europe, Finland and Scotland. No general trend in the % of extensive UAA. Increases in Estonia, Latvia, Lithuania, Finland, Scotland and some Mediterranean regions. Constant in Central European regions. Changes in the % UAA classified as medium to be analysed regionally to identify directions of change (extensification or intensification). Cross Compliance Assessment Tool
Intensity assessment -Conclusions Cross Compliance Assessment Tool • Intensity changes due to CC are quite small. • Regional results obtained with this assessment should be further analysed separately. • However some general trends emerge: • Livestock intensity: Extensification in Scandinavian and Eastern European countries and North Western Iberian Peninsula regions vs. Intensification in Central European Countries and Mediterranean regions (except Italy) • Landuse intensity Extensification in Mediterranean, Scandinavian and Eastern countries vs. Intensification in Central European countries. Cross Compliance Assessment Tool
Effects of CC standards on Biodiversity and Landscape Juan J. Oñate & Patricia Martínez (UAM)Brussels, 30 March 2010