Download
1 / 70
700 likes | 884 Views
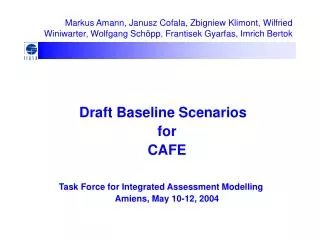
Markus Amann, Janusz Cofala, Zbigniew Klimont, Wilfried Winiwarter, Wolfgang Sch ö pp, Frantisek Gyarfas, Imrich Bertok. Draft Baseline Scenarios for CAFE Task Force for Integrated Assessment Modelling Amiens, May 10-12, 2004. BASELINE PROJECTION. OPTIMIZATION. Environmental targets.

E N D
Markus Amann, Janusz Cofala, Zbigniew Klimont, Wilfried Winiwarter, Wolfgang Schöpp, Frantisek Gyarfas, Imrich Bertok Draft Baseline Scenariosfor CAFE Task Force for Integrated Assessment ModellingAmiens, May 10-12, 2004
BASELINE PROJECTION OPTIMIZATION Environmental targets Integrated assessment in CAFE Energy/agriculture projections Driving forces Emission control options Emissions Costs Atmospheric dispersion Health and environmental impacts
Bilateral consultationsMain issues Energy projections: • Discrepancies of year 2000 energy statistics • Comments on PRIMES projections • Obvious discrepancies • Differences in expectations Emission calculations: • Review of year 2000 emission inventory • Penetration rates of control measures • Emission control potential for • SO2, NOx, VOC, NH3, PM10/2.5
Bilateral consultations (1) Red numbers indicate delivery after deadline
Bilateral consultations (2) Red numbers indicate delivery after deadline
CAFE energy baseline projections • Two draft baseline projections – available • include PRIMES numbers plus additional assumptions from national submissions (e.g., share of LDTs in freight transport, fuel use by off-road vehicles and maritime activities, corrections for fuel used outside EMEP area) • National projections - will be implemented by June • Currently available for eight countries, some of them need to be completed or re-formatted • Revised PRIMES projection (with climate) by June
Approach for baseline emission projections • Match nationally reported emission inventories for 2000 • Problem: for some countries important differences between subsequent submissions (e.g., to CLRTAP, NEC, new national total different by > 10%) • Values reported to CLRTAP plus changes documented during consultations taken into account • Extrapolate penetration rates of control measures up to 2020 • Takes international and national legislation into account • Done together with national teams to also include “current practices”
Transport emissions - approach (1) • Exhaust emissions – fuel use from PRIMES • Non-exhaust emissions – veh-km (derived from fuel use) • Turnover of fleet taken from national estimates • National emission factors applied where available (Auto/Oil estimates modified during consultations) • Efficiencies of EURO-stages based on Auto/Oil info plus other sources (TREMOD, Austrian model, RICARDO - for EURO 5/6)
Transport emissions - approach (2) • Impact of cycle-beating for trucks on NOx considered (ARTEMIS Project, report by TU Graz, 2003),generates inconsistencies with some national 2000 emission inventories • Other findings of ARTEMIS not included • Data for off-road sources from EGTEI • Consistency with TREMOVE not yet established • Further calibration and updates is needed when new data become available
Next steps June 2004 • Incorporation of national scenarios • Feedbacks on the 2 draft emission scenarios • Revised PRIMES scenario (with climate measures) taking into account country comments September 2004 • First set of policy scenarios
No further climate measures With climate measures Solid fuels Liquid fuels Natural gas Renewable Nuclear Difference to "no further climate measures" Energy use per fuel EU-15 [PJ]
No further climate measures With climate measures Solid fuels Liquid fuels Natural gas Renewable Nuclear Difference to "no further climate measures" Energy use per fuelNew Member States [PJ]
Cattle Pigs Chicken Other animals Animal numbers (pre-CAP reform),relative to 2000 EU-15 New Member States
Comparison of 2000 SO2 inventoriesRAINS vs. national estimates
SO2 emissions • Measures: • Large Combustion Plant Directive • S Content of Liquid Fuels Directive • Directives on quality of petrol and diesel fuels • IPPC legislation on process sources • National legislation and national practices (if stricter)
No further climate measures With climate measures x---------------- x---------------- NEC Ceiling 3850 kt Power generation Industry Households Transport Process emissions "Climate bonus" SO2 emissions by sector EU-15 [kt]
No further climate measures With climate measures x---------------- x---------------- NEC Ceiling 2693 kt Power generation Industry Households Transport Process emissions "Climate bonus" SO2 emissions by sector New Member States [kt]
Projected SO2 emissions in 2010compared to NEC emission ceilings, EU-15
Projected SO2 emissions in 2010compared to NEC emission ceilings, NMS
Comparison of 2000 NOx inventoriesRAINS vs. national estimates
NOx emissions Assumed measures: • LCP Directive • Auto/Oil EURO standards • Standards for motorcycles and mopeds • Legislation on non-road mobile machinery • Implementation failure of EURO-II and III for HDT • IPPC legislation on process sources • National legislation and national practices (if stricter)
No further climate measures With climate measures x---------------- NEC Ceiling 6519 kt x--------------- Power generation Industry Households Transport Process emissions "Climate bonus" NOx emissions by sectorEU-15 [kt]
No further climate measures With climate measures x---------------- x---------------- NEC Ceiling 1800 kt Power generation Industry Households Transport Process emissions "Climate bonus" NOx emissions by sectorNew Member States [kt]
Projected NOx emissions in 2010compared to NEC emission ceilings, EU-15
Projected NOx emissions in 2010compared to NEC emission ceilings, NMS
Comparison of 2000 VOC inventoriesRAINS vs. national estimates
VOC emissions • Assumed measures: • Stage I Directive • Directive 91/441 (carbon canisters) • Auto/Oil EURO standards • Fuel Directive (RVP of fuels) • Solvents Directive • Product Directive (paints) • National legislation, e.g., Stage II
10000 8000 x--------------- NEC Ceiling 6510kt 6000 4000 2000 0 2000 2005 2010 2015 2020 Stationary combustion Mobile sources Fuel extraction+distribution Industrial processes Solvents VOC emissionsEU-15 [kt]
x--------------- NEC Ceiling 1640 kt VOC emissions New Member States [kt]
Projected VOC emissions in 2010compared to NEC emission ceilings, EU-15
Projected VOC emissions in 2010compared to NEC emission ceilings, NMS
Comparison of 2000 NH3 inventoriesRAINS vs. national estimates
NH3 emissions Assumed measures: • No EU-wide legislation • National legislations • Current practice
x--------------- NEC Ceiling 3310 kt NH3 emissions EU-15 [kt]
x--------------- NEC Ceiling 866 kt NH3 emissions New Member States [kt]
Projected NH3 emissions in 2010compared to NEC emission ceilings, EU-15
Projected NH3 emissions in 2010compared to NEC emission ceilings, NMS
Comparison of 2000 PM2.5 inventoriesRAINS vs. national estimates
PM10 emissions • Assumed measures: • LCP Directive • Auto/Oil EURO standards • Standards for motorcycles and mopeds • Legislation on non-road mobile machinery • IPPC legislation on process sources • National legislation and national practices (if stricter)
No further climate measures With climate measures Power generation Industry Households Transport Process emissions Waste+agriculture Primary PM2.5 emissions by sector EU-15 [kt]