Section 8.3
Section 8.3. Estimating Population Means ( Unknown). And some valuable added stuff by D.R.S., University of Cordele. Should I use z or t for my confidence interval?. We have two bell-shaped distributions, z and t. Which one to use?.

Section 8.3
E N D
Presentation Transcript
Section 8.3 Estimating Population Means ( Unknown) And some valuable added stuff by D.R.S., University of Cordele
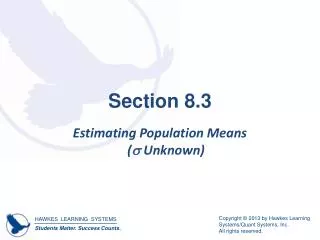
Should I use z or t for my confidence interval? We have two bell-shaped distributions, z and t. Which one to use? I need more advanced techniques that are beyond the scope of this course. Is the population approximately normally distributed? Do I have a “big” sample? no no yes yes Use t Use z Do I know the value of σ, the population’s standard deviation?
Estimating Population Means ( Unknown) Margin of Error of a Confidence Interval for a Population Mean (Unknown) When the population standard deviation is unknown, the sample taken is a simple random sample, and either the sample size is at least 30 or the population distribution is approximately normal, the margin of error of a confidence interval for a population mean is given by
Estimating Population Means ( Unknown) Margin of Error of a Confidence Interval for a Population Mean (Unknown) (cont.) Where is the critical value for the level of confidence, c = 1 − , such that the area under the t-distribution with n − 1 degrees of freedom to the right of is equal to s is the sample standard deviation, and n is the sample size.
The formula for E in a t problem isvery much like the formula for E in a zproblem They have the same arithmetic structure. Difference: using sample standard deviation s instead of population standard deviation σ. , the margin of error: Same: square root of the sample size, Difference: using a t critical value instead of a z critical value.
Example 8.15: Finding the Margin of Error of a Confidence Interval for a Population Mean (Unknown) Dental researchers want to estimate the mean leakage, measured in nanometers (nm), of a new filling material for cavities using a simple random sample of 10 trials. Assuming that the population distribution is approximately normal and the population standard deviation is unknown, find the margin of error for a 95% confidence interval for the population mean given that the sample standard deviation is 15.5 nm. Taking notes as you read through the problem: 10 = _____ 95% = _____ 15.5 nm = ______
Example 8-15 – Dental Filling Material Continuing with Should we use z or t or do we need advanced techniques? Use ___ because ____________________ and _________________________________. So we need α = _____ and α/2 = _____ and d.f. = ____ Lookup in table or use invT to find tα/2 = ______ 10 = _____ 95% = _____ 15.5 nm = ______
Example 8-15 – Dental Filling Material Plug in and Compute the Margin of Error (include Units) Note – this problem stops here. It doesn’t actually go all the way to compute a confidence interval. We would need a of the sample, too, to do everything.
Estimating Population Means ( Unknown) Confidence Interval for a Population Mean The confidence interval for a population mean is given by Where is the sample mean, which is the point estimate for the population mean, and E is the margin of error.
Example 8.16: Constructing a Confidence Interval for a Population Mean (Unknown) A marketing company wants to know the mean price of new vehicles sold in an up-and‑coming area of town. Marketing strategists collected data over the past two years from all of the dealerships in the new area of town. From previous studies about new car sales, they believe that the population distribution looks somewhat like the following graph. QUESTION: Is the population distribution approximately normal? ____________________
Example 8.16: Constructing a Confidence Interval for a Population Mean (Unknown) (cont.)
Example 8.16: Constructing a Confidence Interval for a Population Mean (Unknown) (cont.) The simple random sample of 756 cars has a mean of $27,400 with a standard deviation of $1300. Construct a 95% confidence interval for the mean price of new cars sold in this area. Make some notes as you read: 756 = _____ $27400 = _______ $1300 = ______ 95% = ______ so _____ = ______ and ____ / 2 = ______ Should we use z or use t or do we need a technique that’s not part of this course? __________________________
Example 8-16 – Car Prices, continued Compute the margin of error, E. You’ll need d.f. = _____. Determine the confidence interval, : State a conclusion in plain English: “We are _____% confident that __________________________________ is between $__________ and $__________
Example 8-16 – Car Prices, continued Do the same problem again, but this time use TI-84 STAT, TESTS, 8:TInterval What does the TI-84 givefor the confidence interval? It does not tell you the margin of error, E, directly. But could you figure out E from the information shown?
Example 8.17: Constructing a Confidence Interval for a Population Mean ( Unknown) A student records the repair costs for 20 randomly selected computers from a local repair shop where he works. A sample mean of $216.53 and standard deviation of $15.86 are … computed. Assume that the population distribution is approximately normal and is unknown. Determine the 98% confidence interval for the mean repair cost for all computers repaired at the local shop. Notes as you go: 20 = ___ $216.53 = ___ $15.86 = ___ 98% = ____ so ____ = ___ and ____ / 2 = ______ And also, use z or t or something else? _____ because ________
Example 8-17 – Computer Repair Costs, continued Compute the margin of error, E. You’ll need d.f. = _____. Determine the confidence interval, : State a conclusion in plain English: “We are _____% confident that __________________________________ is between $__________ and $__________
Example 8-17 – Computer Repair Costs, continued Do the same problem again, but this time use TI-84 STAT, TESTS, 8:TInterval What does the TI-84 givefor the confidence interval? RECOMMENDED: Use TInterval instead of the primitive formulas, unless you have to use the formula to answer a crazy question on HW or exam. Or if you do both the formula + Tinterval, it’s a nice way to double-check your work.
Example 8.17 with Excel:=CONFIDENCE.T(alpha, sample stdev, sample size) . . . n = 20 computers . . . sample mean of $216.53 and standard deviation of $15.86 . . . the population distribution is approximately normal and is unknown. a. Determine the 98% confidence interval …
Further words about ZInterval and TInterval If you’re asked for a confidence interval, • Use ZInterval for a normal distrib. situation. • Use TInterval for a t-distribution situation. If the problem asks for a critical value of z or t, too, • Then you have to use invNorm( or invT( or a printed table to answer that question. Make the right choice between • Stats, if you’re given the mean, etc. • Data, if you’re given a list of raw data
Example 8.18: Constructing a Confidence Interval for a Population Mean (Unknown) from Original Data Given the following sample data from a study on the average amount of water used per day by members of a household while brushing their teeth, calculate the 99% confidence interval for the population mean using a TI-83/84 Plus calculator. Assume that the sample used in the study was a simple random sample. Should we use z or t or some other advanced technique? And why?
Example 8.18: Constructing a Confidence Interval for a Population Mean (Unknown) from Original Data (cont.) *
Example 8.18: Constructing a Confidence Interval for a Population Mean (Unknown) from Original Data (cont.) To begin with, since we are given the raw data and not the sample statistics, we need to enter the data in the calculator list, like in L1. Then use TInterval, but this time highlight the Data option, not the Stats option! You’ll see some differences in the prompts. Confidence interval result is ( _________, ___________ ) Conclusion: _____ % confident that ___________________ _______________________