Download
1 / 7
70 likes | 314 Views
A Business Plan for Africa Breakaway Sessions 4: Execution plan by regional clusters. Session 3: Central Africa. November 8th, 2013. 5 African Clusters. North Africa. Algeria, Egypt, Libya, Morocco, Mauritania, Sudan, Tunisia. Member states: 7 Population (million): 212

E N D
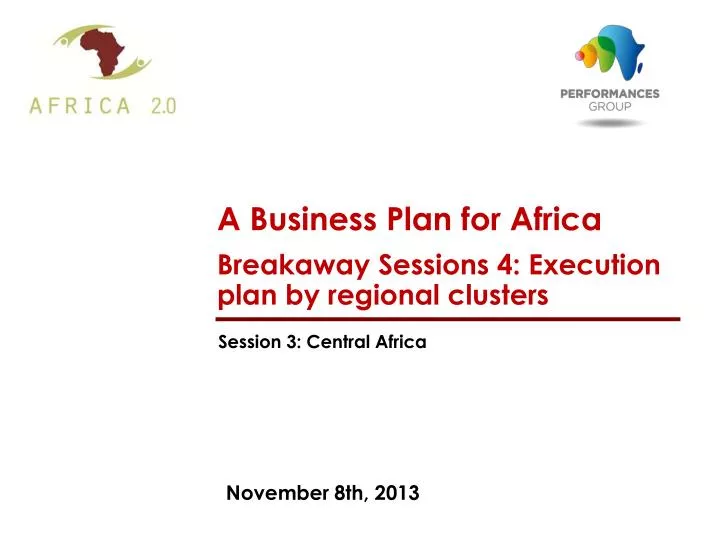
A Business Plan for Africa Breakaway Sessions 4: Execution plan by regional clusters Session 3: Central Africa November 8th, 2013
5 African Clusters North Africa Algeria, Egypt, Libya, Morocco, Mauritania, Sudan, Tunisia Member states: 7 Population (million): 212 GDP (mds $US): 754 West Africa Benin, Burkina Faso, Cape Verde, Cote d’Ivoire, Gambia, Ghana, Guinea, Guinea Bissau, Liberia, Mali, Niger, Nigeria, Senegal, Sierra Leone, Togo East Africa Burundi, Comoros, Djibouti, Eritrea, Ethiopia, Kenya, Madagascar, Mauritius, Mozambique, Uganda, Rwanda, Seychelles, Somalia, South Sudan, Tanzania Member states: 15 Population (million): 295 GDP (mds $US): 399 Central Africa Member states: 15 Population (million): 277 GDP (mds $US): 196 Angola, Cameroon, Chad, Congo Dem. Rep., Congo, Gabon, Equatorial Guinea, Central African Republic, São Tomé & Príncipe Member states: 9 Population (million): 125 GDP (mds $US): 223 Southern Africa Botswana, Lesotho, Malawi, Namibia, South Africa, Swaziland, Zambia, Zimbabwe Member states: 8 Population (million): 98 GDP (mds $US): 455
GDP per Capita comparison by regional cluster GDP & population by cluster in 2012 $2555 per capita $4642 per capita $1884 per capita $709 per capita $1777per capita Source: World Economic Outlook - July 2013, IMF. Central Africa has the second lowest GDP per capita.
African Clusters Growth comparison Economic growth rates by cluster (2005-2012) Source: African Economic Outlook, 2013 Central Africa’s growth rate was the highest at the beginning of the period, and is now around the average 5% of all African clusters.
Comparing African Clusters by economic sectors North Africa Southern Africa Central Africa Eastern Africa West Africa Source: World Economic Outlook - July 2013, IMF.
Action prioritization Matrix and Stakeholder Engagement Matrix Complete the Action Prioritization Matrix below with the key short, medium and long-term actions to leapfrog the cluster’s development. For each identified leapfrogging action, complete the Stakeholder Engagement Matrix below: