Download
1 / 16
160 likes | 349 Views
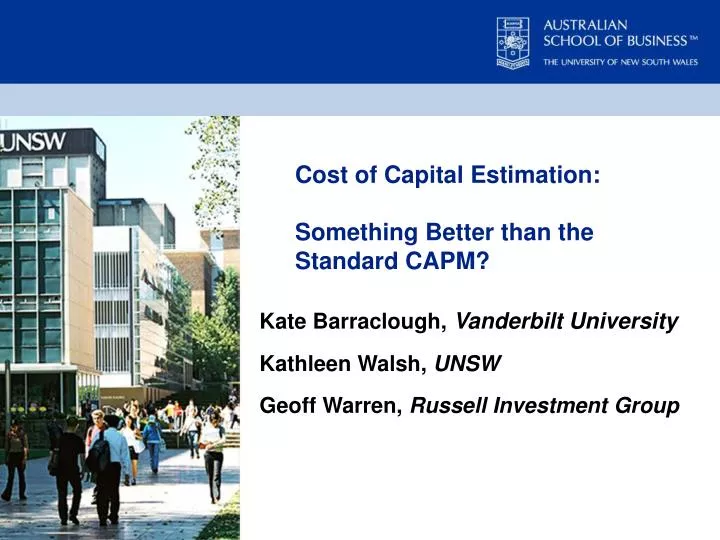
Cost of Capital Estimation: Something Better than the Standard CAPM?. Kate Barraclough, Vanderbilt University Kathleen Walsh, UNSW Geoff Warren, Russell Investment Group. Overview. Introduction Essentially a Horse Race Models and Data Who gets to saddle up? Criteria

E N D
Cost of Capital Estimation: Something Better than the Standard CAPM? Kate Barraclough,Vanderbilt University Kathleen Walsh, UNSW Geoff Warren, Russell Investment Group
Overview • Introduction • Essentially a Horse Race • Models and Data • Who gets to saddle up? • Criteria • How do we judge the race? • Results • Who wins the race? • Conclusions • Implications of the race • Where to next?
Introduction • Horse race for practitioners to consider academic models for cost of capital estimation • Highlights measurement error • Multi factor models may never provide a practical alternative • Liquidity adjustment produces a more plausible distribution of cost of capital estimates.
Models and Data • Base Case - Standard CAPM • Adjusted for: • Industry Betas • Thin Trading
Models and Data • Criteria for selection • Acceptability by academics and practitioners • Practicality for implementation • Fama French Three Factor Model (1993) • CAPM + Liquidity • Two Beta CAPM
Models and Data • CAPM + Liquidity Factor • Estimation parallels that for the standard CAPM and 3-factor model, with factor loadings estimated by a multiple regression of stock returns on returns to factor mimicking portfolios • CAPM + Liquidity Premium • the standard CAPM with a liquidity adjustment reflecting the percentile ranking of a stock based on some liquidity measure.
Models and Data • Liquidity Measures
Models and Data • Two Beta CAPM • Asset prices are moved by changes in cash flows and discount rates: • Think about the numerator and denominator in a DCF • Different implications: cash flow losses tend to be ‘permanent’, whereas discount rate movements reorder return profile over time • Assets can have different sensitivities to these two elements • Aligns with ‘cyclical’ versus ‘interest-rate sensitive’ stocks
Models and Data • Campbell & Vuolteenaho propose a neat and intuitive two-beta version of CAPM in their “Bad Beta, Good Beta” paper (AER, 2004) • Decompose return on market into ‘cash flow’ and ‘discount rate’ elements, and estimate beta on each component • Decomposition based on Change in VIX MRPt = 0.0050 - 0.795·CHVIXSQt + εt • Decomposition based on Change in VIX MRPt = 0.0048+ 1.187·CHLTGt + єt
Models and Data • Decomposition based on Change in VIX • Decomposition based on Change in VIX • Estimation of Factor Risk Premiums: Based on VIX Mean(XRIk) = 0.0051 + 0.00155·βVIX(CF)k - 0.00114·βVIX(DR)k + uk • Estimation of Factor Risk Premiums: Based on Long-Term Growth Forecasts Mean(XRIk) = 0.0058 + 0.00541·βLTG(CF)k - 0.00036 ·βLTG(DR)k + uk
Models and Data • Estimation of Factor Risk Premiums: Based on VIX CF% (VIX) = 0.00155 / (0.00155 + 0.00114) = 0.576 DR% (VIX) = 1 - CF%(VIX)) = 0.424 • Estimation of Factor Risk Premiums: Based on LTG CF% (LTG) = 0.00541 / (0.00541 + 0.00036) = 0.938 DR% (LTG) = 1 - CF%(LTG)) = 0.062
Judging Criteria • Plausibility of the estimate distribution • Relation with average return over the subsequent 1 to 5 years • Relation with implied cost of equity estimates • Contrasts with Academic tests • Individual security rather than portfolio • Apply existing models rather than testing new ones • Implemented using market based data • C&V – VIX and I/B/E/S
Results • CAPM+LP emerged as the ‘best’ model • Possible magnitude of measurement error • Thin-trading and beta estimates • CAPM+LP model with Dimson betas (LP based on LCOMB) • Risk premium distribution and measurement error • Contrasting two-beta results as a warning • Lack of strong signals
Conclusions • Fama French Model results in too much estimation error to be considered for individual stock cost of capital • Standard CAPM is good considering all the bad press, but the inclusion of liquidity improves performance • Two Beta CAPM looks promising but both approaches should yield same results so relying on one is suspect • Watch this space for further development of CAPM +LP