Introduction to Visibilities
230 likes | 252 Views
This introduction provides an overview of visibilities in image calibration and measurement of Fourier components in a source image. It explains the role of visibilities, the measurement of single visibilities, properties of image visibilities, and the process of measuring visibilities with RHESSI.

Introduction to Visibilities
E N D
Presentation Transcript
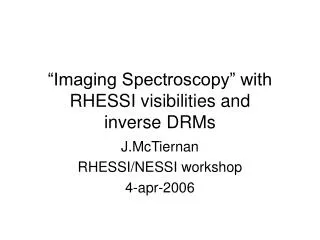
Introduction to Visibilities Gordon Hurford Annapolis – 4-Aug-2010
What are Visibilities? A visibility is the calibrated measurement of a single Fourier component of the source image. V(u,v) = ∫∫ I(x,y) e i(uv+vy) dx dy
Time-modulated RMC light curve (=eventlist) Role of Visibilities Superimposes rotations Minor information loss Stacked Event List Ignores some data Default approach Set of measured visibilities Calibrated & compact Can be evaluated by user Fourier transform Image • Visibilities represent an intermediate step between modulated signal and image.
Single Visibility Measurement A visibility measures one Fourier component of source image. Typical modulated light curve Visibility for one RMC at one orientation is determined by calibrated amplitude and phase of modulation V(u,v) = A e iΦ u, v define spatial frequency at which the visibility is measured √( u2 + v2 ) = 0.5 / (FWHM resolution) TAN (orientation) = v / u USEFUL PROPERTY: Unmodulated background is ignored.
A Φ V(u,v) = ∫∫ I(x,y) e i(uv+vy) dx dy Image Visibility Single Visibility Properties • For single sources: • Amplitude depends on flux • and size • Phase depends on position • For multicomponent sources: • Visibilities add vectorally
Relative Visibility vs Spatial Frequency for Gaussian and circle Effect of Shape differences are manifest at low values of relative visibiity
Image Visibilities x,y u,v
Image Visibilities x,y u,v
Image Visibilities x,y u,v
Image Visibilities x,y u,v
Image Visibilities x,y u,v
Image Visibilities x,y u,v rhessiu,v
Measuring Visibilities with RHESSI • Map calibrated eventlist to roll/phase bins with stacker. (This is the only time-consuming step.) • For each roll bin, fit count rate vs phase. • Save measured visibilities as a “bag of visibilties”. • Optionally display / edit / combine visibilities. • Use visibilities in your application.
Typical plots of rate vs phase bin at 8 roll orientations. Rate vs Phase Bin Fits 5 parameter fits of amplitude and phase at fundamental and 2nd harmonic USEFUL PROPERTY: Evaluates statistical errors in visibilities.
Amplitude and phase vs position angle RMC 7 RMC 6 Displaying Visibilities USEFUL PROPERTIES: Amplitudes and phases are fully calibrated (ph/cm2/s). Phase coherence is a reliable indicator of ‘detection’. Conjugate visibilities can be averaged.
No visibilities measured No visibilities measured How many visibilities does RHESSI measure?How many roll bins should be used? If roll bins are too small, many visibilities will be missing. This occurs when modulation is slow. (e.g. 16 roll bins modulation period must be < ¼ second) Coarse RMC’s & sources close to rotation axis Slow modulation
Why not make the roll bins quite large? • Average over rotation angles in a single roll bin is equivalent to azimuthally smearing source relative to map center • 3 Equivalent ways of viewing the effect of large roll bins • Imaged source will be azimuthally smeared • Reduced sensitivity to point sources near edge of FOV • Some of the finer amplitudes will be reduced.
+ Choosing number of roll bins • Optimum number of roll bins depends on • RMC # • Distance of source from rotation axis • Maximum source extent (radius of bounding circle) • Source axis distance / RMC resolution Minimum size of roll bin • Source extent / RMC resolution Maximum size of roll bin • Choose map center at center of bounding circle. • Then • User specifies explicitly OR • User indicates maximum source extent (phz_radius) and software chooses
RHESSI visibilities are very good at getting 1st 3 moments of simple sources Flux, size, location Best Fit Circular Source
First 3 moments are not always the full story. RHESSI cannot image complex sources, but visibilities may tell you that a few details are missing.