Visualization History
740 likes | 950 Views
Visualization History. Visualization libraries Embed into simulation code Outputs images (plots) during run-time. Post-process of restart dumps Custom tools for custom data formats Custom derived data, data mappers. Visual Programming. Haberli’s landmark ConMan paper -1985?

Visualization History
E N D
Presentation Transcript
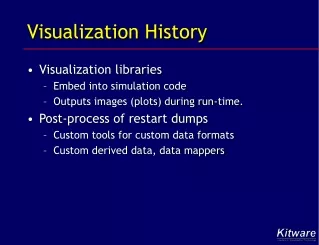
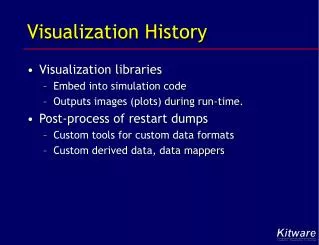
Visualization History • Visualization libraries • Embed into simulation code • Outputs images (plots) during run-time. • Post-process of restart dumps • Custom tools for custom data formats • Custom derived data, data mappers
Visual Programming • Haberli’s landmark ConMan paper -1985? • Extension of Unix pipes. • Take a small specialized program • Provide wrapper for remote procedure and shared memory • Provide GUI for parameters (args) of the program.
Early Visual Prog. Env. • Data Push models • aPe - Ohio State / OSC • AVS - Advanced Visualization System • Stellar Computer • Khoros - Univ. of New Mexico? • Iris Explorer – SGI / NAG • Data Flow model
Great concepts • Very similar to Corba support • provides the shared memory communication • each “module” is it’s own process • Can reside on it’s own CPU • Can reside across the network • Tools to automatically convert a C, C++ or Fortran program to a module.
Problems • Data pushed to module A • Data modified by A (a “mapper”) and pushed to both modules B and C. • Four copies of the data now exist Read A B C
Execution Model • Each module has a set of parameters or state that controls its output. • A change to Module B’s parameters only requires re-executing B. • A change to Module A’s parameters, will re-execute A and send new data to both B and C. Read A B C
Data Push vs Data Pull • Data Push • Push data when changed • Data Pull • Only request data when needed • Break the data into chunks, and only request small chunks at a time. • Multiple windows (paths) • Memory requirements reduced
Early Visual Prog. Env. • Data Pull Models • Data Explorer (Dx) - IBM • Data centric • AVS/Express • Image Vision - SGI • Java Advanced Imaging • Vtk • Much more complicate, Much more flexible
VTKThe Visualization Toolkit William J. Schroeder President, Kitware, Inc. Rensselaer SCOREC Research Associatewww.kitware.com www.vtk.org will.schroeder@kitware.com Modified byRoger Crawfis
Themes • Overview • Architecture • Graphic Subsystem • Visualization Pipeline • Interaction • Software Process • Conclusion
Taxonomy of Visualization Systems • Toolkits / Libraries • Components • Little or no GUI • Meant to be integrated with other systems/toolkits • Programming required • Development Environments • Components • GUI-assisted (visual) programming • Applications • Turn-key • Minimal programming
What Is VTK? A visualization toolkit • Designed and implemented using object-oriented principles • C++ class library (~700+ classes; ~425,000 LOC; <225,000 executable lines) • Automated Java, TCL, Python bindings • Portable across Unix, Windows, Mac OSX • Supports 3D/2D graphics, visualization, image processing, volume rendering • Focused on scientific visualization, some support for higher-dimensional visualization • Open-source (BSD-style, not GPL) • www.vtk.org
VTK Is A Toolkit, Not a System • Embeddable • Plays with other software • Separable • Can pull out “pieces” • Adaptable • Not dependent on GUI • X, Motif, Windows, Mac, Qt, FLTK, Tk, wxWindows, etc. • Not dependent on rendering library • OpenGL, others
History • Precursor: GE Legacy System LYMB (circa 1983) • Proprietary software issues led to open-source VTK project to create: • Textbook • Sample code • December ‘93 work begins on VTK text/software • June 1998 Kitware forms: VTK Commercial Support
Functionality • Graphics / Modeling • Smoothing, decimation, extrusion, Delaunay triangulation (2D/3D), etc. • Image Processing • 100’s of filters • Integrated 2D / 3D • Visualization • Scalar, vector, tensor fields (100’s of filters) • Probing, cutting, clipping, extraction • Volume rendering • Multi-dimensional • Projection, resampling
How To Use It • Choose programming language • C++ • Tcl • Python • Java • Assemble components to build applications
Typical Application (in C++) vtkSphereSource *sphere = vtkSphereSource()::New(); // create data pipeline vtkPolyDataMapper *sphereMapper = vtkPolyDataMapper::New(); sphereMapperSetInput(sphereGetOutput()); vtkActor *sphereActor = vtkActor::New(); sphereActorSetMapper(sphereMapper); // mapper connects the actor with pipeline vtkRenderer *renderer = vtkRenderer::New(); // graphics library independent vtkRenderWindow *renWin = vtkRenderWindow::New(); renWinAddRenderer(renderer); vtkRenderWindowInteractor *iren = vtkRenderWindowInteractor::New(); irenSetRenderWindow(renWin); rendererAddActor(sphereActor); rendererSetBackground(1,1,1); renWinSetSize(300,300); renWinRender(); irenStart(); // being event loop
Architecture • Compiled / Interpreted • C++ core • Tcl, Python, Java wrappers • Subsystems • Graphics • Visualization pipeline • Image processing • 3D data processing • Interaction
Wrappers C++core VTK Architecture • Compiled C++ core • Performance • Code correctness • Wrapper layer • Often interpreted (e.g. Tcl) • Can be compiled layer • Microsoft COM Wrapper layergenerated automatically during build process
Tcl Interpreter • source vtkInt.tcl (define interpreter GUI)
TclvtkShrinkFilter sfsf SetShrinkFactor 0.8vtkPolyDataMapper mm SetInput [ sf GetOutput ] Code Comparison • C++ vtkShrinkFilter *sf;sf = vtkShrinkFilter::New();sf->SetShrinkFactor(0.8); vtkPolyDataMapper *m; m = vtkPolyDataMapper::New(); m->SetInput( sf->GetOutput() );
Graphics Subsystem • Lights • Cameras • Actors • Mappers • Transforms • Properties • Render Window • Renderer
The VTK Graphics Subsystem A VTK scene consists of: • vtkRenderWindow - contains the final image • vtkRenderer - draws into the render window • vtkActor - combines properties / geometry • vtkProp, vtkProp3D are superclasses • vtkProperty • vtkLights - illuminate actors • vtkCamera - renders the scene • vtkMapper - represents geometry • vtkPolyDataGeometry, vtkDataSetMapper are subclasses • vtkTransform - position actors
Graphics Model Instances of render window (vtkRenderWindow) Renderer instances(vtkRenderer) Actor instances(vtkActor)
Visualization Pipeline • Data objects • Process objects • Pipelines • Managing execution
Mapper Mapper Source The Visualization Pipeline A sequence of process objects that operate on data objects to generate geometry that can be rendered by the graphics engine or written to a file Filter Actor to graphicssystem Data Data Data Filter Actor Data
Visualization Model • Data Objects • represent data • provide access to data • compute information particular to data(e.g., bounding box, derivatives) • Process Objects • Ingest, transform, and output data objects • represent visualization algorithms
vtkDataObject / vtkDataSet • vtkDataObject represents a “blob” of data • contain instance of vtkFieldData • an array of arrays • no geometric/topological structure • Superclass of all VTK data objects • vtkDataSet has geometric/topological structure • Consists of geometry (points) and topology (cells) • Has associated “attribute data” (e.g., scalars, vectors) as well as field data • Convert data object to data set with vtkDataObjectToDataSetFilter
Array of arrays Field Data Geometry& Topology Points& Cells Attribute Data Point DataCell Data vtkDataObject / vtkDataSet vtkDataObject Concept Implementation Structure vtkDataSet AssociatedData
Cell Points Dataset Model • A dataset is a data object with structure • Structure consists of • points (x-y-z coordinates) • cells (e.g., polygons, lines, voxels) that are defined by connectivity list referring to points ids • Access is via integer ID • implicit representations • explicit representations
vtkDataSet Subclasses vtkImageData vtkRectilinearGrid vtkUnstructuredGrid vtkStructuredGrid vtkPolyData
Data Set Attributes • vtkDataSet also has point and cell attribute data: • Scalars – (multi-component) • Vectors - 3-vector • Tensors - 3x3 symmetric matrix • Normals - unit vector • Texture Coordinates 1-3D • Array of arrays (I.e. FieldData)
Scalars (An Aside) • Scalars are represented by a vtkDataArray • Scalars are typically single valued • Scalars can also represent color • I (intensity) • IA (intensity-alpha: alpha is opacity) • RGB (red-green-blue) • RGBA (RGB + alpha) • Scalars can be used to generate colors • mapped through lookup table • if unsigned char direct color specification
1 or more inputs Source 1 or more inputs Filter 1 or more outputs Mapper 1 or more outputs Process Objects • Process objects operate on data objects
Pipeline Execution Model direction of data flow (via Execute()) Source Filter Mapper Render() Data Data direction of update (via Update())
Creating Pipeline Topology • aFilter->SetInput( bFilter->GetOutput()); • The Role of Type-Checking • SetInput() accepts dataset type or subclass • C++ compile-time checking • Interpreter run-time checking
vtkBYUReader vtkDecimatePro vtkSmoothPolyDataFilter vtkPolyDataNormals vtkPolyDataMapper Example Pipeline • Decimation, smoothing, normals • Implemented in C++ Note: data objects are notshown they are impliedfrom the output type of thefilter
Create Reader & Decimator vtkBYUReader *byu = vtkBYUReader::New(); byu->SetGeometryFileName("../../vtkdata/fran_cut.g”); vtkDecimatePro *deci = vtkDecimatePro::New(); deci->SetInput( byu->GetOutput() ); deci->SetTargetReduction( 0.9 ); deci->PreserveTopologyOn(); deci->SetMaximumError( 0.0002 );
Smoother & Graphics Objects vtkSmoothPolyDataFilter *smooth = vtkSmoothPolyDataFilter::New(); smooth->SetInput(deci->GetOutput()); smooth->SetNumberOfIterations( 20 ); smooth->SetRelaxationFactor( 0.05 ); vtkPolyDataNormals *normals = vtkPolyDataNormals::New(); normals->SetInput( smooth->GetOutput() ); vtkPolyDataMapper *cyberMapper = vtkPolyDataMapper::New(); cyberMapper->SetInput( normals->GetOutput() ); vtkActor *cyberActor = vtkActor::New(); cyberActor->SetMapper (cyberMapper); cyberActor->GetProperty()->SetColor ( 1.0, 0.49, 0.25 ); cyberActor->GetProperty()->SetRepresentationToWireframe();
More Graphics Objects vtkRenderer *ren1 = vtkRenderer::New(); vtkRenderWindow *renWin = vtkRenderWindow::New(); renWin->AddRenderer( ren1 ); vtkRenderWindowInteractor *iren = vtkRenderWindowInteractor ::New();iren->SetRenderWindow( renWin ); ren1->AddActor( cyberActor );ren1->SetBackground( 1, 1, 1 );renWin->SetSize( 500, 500 ); iren->Start();
Before(52,260 triangles) After Decimationand Smoothing(7,477 triangles) Results
Parallel Processing • Why ? – we have to • Shared memory • Distributed execution • MPI • Abstracted to support other communication • Parallel Mechanisms • Task • Data • Pipeline • Scalable • Petabyte example on 2048 LANL machine (Martin et al. IEEE CG&A July 2001)(A petabyte is 2 to the 50th power (1,125,899,906,842,624) bytes. A petabyte is equal to 1,024 terabytes. )
Examples • Modeling turbulence (Ken Jansen Rensselaer) • 8.5 million tetrahedra (per time step) • 150 million tetrahedra (soon)
Large Data Management • Visible Woman CT Data870 MBytes 1734 Slices at 512x512x2 • Bell-Boeing V-2 2 tiltrotor140 Gbytes
Filter Streaming Pipeline • Basic idea: handle any size data on any size computer • Data is broken into pieces, and pieces processed one at a time through pipeline • Piece size based on memory limits • Can avoid system swap • Supports parallel processing • Issues • How to create pieces • Mapping output from input • Results invariance
zMin zMax yMin yMin xMin xMax yMin yMin xMin xMax Pieces Graphics Imaging: i,j,k extents. image->SetUpdateExtent(0, 128, 0, 128, 0, 90); data->SetUpdateExtent(0, 2); image->Update(); data->Update(); Piece = 0 NumberOfPieces = 2