Download

1 / 19
190 likes | 434 Views
Employment effects of selected scenarios from the Energy Roadmap 2050. WG Meeting of the European Sectoral Social Dialogue Committee for the electricity sector 15.11.2013 Brussels dinko.raytchev@ec.europa.eu DG ENER, A1. Outline. Context and timeline Project details Main results.

E N D
Employment effects of selected scenarios fromthe Energy Roadmap 2050 WG Meeting of the European Sectoral Social Dialogue Committee for the electricity sector 15.11.2013 Brussels dinko.raytchev@ec.europa.eu DG ENER, A1
Outline • Context and timeline • Project details • Main results
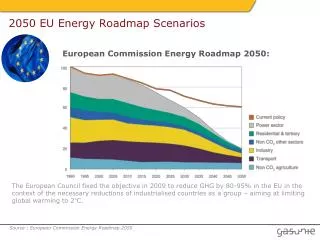
1. Context and timeline (1)The Energy Roadmap to 2050 • Nov. 20082nd SER: EC to prepare an energy policy roadmap towards a low carbon energy system; in line with the EU growth agenda set out in the Europe 2020 strategy • Feb. 2009, Oct. 2009The European Parliament and the EU Council support an EU objective to reduce GHG by 80-95% wrt 1990 levels, as estimated by IPCC • Feb. 2011The EU Council reconfirms the reduction commitment, recognizes it will require a revolution in the EU energy systems; fixing intermediary targets discussed • Dec. 2011The EC adopts the Communication, IA and scenario analysis of the Energy Roadmap to 2050
1. Context and timeline (2)The study of empl. effects of RM2050 scenarios • 2012 Following a recommendation from the IAB, DG ENER commissioned a study analysing potential impacts of decarbonisation scenarios on jobs and skills • Dec. 2012 - Oct. 2013Work on the study • Nov. 2013 – Dec. 2013Discussion of results with stakeholders • Dec. 2013 – Jan. 2014DG ENER to decide on the dissemination of the findings and conclusions of the report
2. Project details • The tender under an existing framework contract was awarded to a Consortium led by • COWI • which included • Cambridge Econometrics, • Exergia E3M Lab, NTUA, • Enrst&Young • Warwick Institute for Employment Research • Final draft (159 p.), appendices (57 p.) and additional data structured along the tasks identified in the Terms of References
3. Main results (1)3.1 Collection of disaggregated statistical and market employment data in the energy sector • Approach • Combined input from ESTAT LFS, ESTAT SBS, commercial providers (such as Bureau Van Dijk and the EurObserv’ER consortium) • Methodology • Prioritization of data sources by relevance and importance (ESTAT LFS, ESTAT SBS, Amadeus micro data, EurObserv’ER, Consortium calculations) • Apportioning used. The tables are filled gradually giving priority of the first choice data source. If elements of the tables are not available, then a lower order data choice is taken and the data from it is apportioned to match comparable aggregated values from the higher order data choice.
3. Main results (2)3.1 Collection of disaggregated statistical and market employment data in the energy sector • 2,5 millionpeople directly employed in the energy sectors across EU28 • It represents about1% of the total employmentin all sectors
3. Main results (3)3.1 Collection of disaggregated statistical and market employment data in the energy sector • 0.6 million directly employed in power generation(employment numbers are given in brackets): • fossil fuels (32 800), • hydro (160 400), • nuclear (141 700), • solar (88 200), • wind (55 200), • geothermal (8 000), • biomass (106 500) and • tidal (100) • 0.5 million directly employed in transmission(67 500) and distribution(425 900) of electricity and about140 000were employed intransmission and distribution of natural gas
3. Main results (4)3.1 Collection of disaggregated statistical and market employment data in the energy sector • The statistical chapter contains detailed tables and charts on: • • Number of companies per relevant sector; • • Direct and indirect employment in the renewable sectors (including a split on manufacturing, installation, operation and maintenance); • • Direct employment by MS and by NACE sector with the power generation sector broken down by generation technology
3. Main results (5)3.2 Literature review • What are the methods used in literature to estimate the employment impacts of energy policies? • What type of workers are most/least sensitive to different energy policies? • Which sectors benefit most/least from different types of energy policies (e.g. energy-efficiency policies, introduction of low-carbon technologies)? • What is the potential for workers from declining sectors to move into new growing sectors? To what extent will these new sectors be competing for skilled labour? • What are the potential labour market impacts of the structural change anticipated in the Energy Roadmap?
3. Main results (5)3.3 The models Cambridge Econometrics uses E3ME, a structural (Keynesian) macroeconometric model of Europe’s economic and energy systems and the environment. Exergia E3M Lab from the National Technical University of Athens uses GEM-E3, a multi-regional, multi-sectoral, recursive dynamic computable general equilibrium (CGE) model which provides details on the macro-economy and its interaction with the environment and the energy system. Employment in the models is determined by a combination of structural change, the revenue recycling, aggregate GDP effects and the reaction in the labour market
3. Main results (7)3.3 Selected empl. results – broader economy
3. Main results (8)3.3 Selected empl. results – broader economy
3. Main results (9)3.3 Selected empl. results – energy sector • Decomposed results for the whole energy sector by NACE (such as in Section 3.1) are not available (energy sector spread around several lines in the previous slide) • Employment results in the power generation sector in the electricity sector are determined by: • input assumptions on the electricity fuel mix (consistent between the models); • coefficients used to determine number of jobs per unit of generation capacity. • (Not by differences in modelling specification)
3. Main results (10)3.3 Selected empl. results – power gen sectorBaseline
3. Main results (11)3.3 Selected empl. results – power gen sectorBaseline vs other scenarios Employment in fossil fuel sectors decreases across all scenarios examined. Employment in other power technologies depends on their deployment suggested by the different scenarios
3. Main results (11)3.3 Selected results – sensitivity analysis • Results across models are fairly robust. • Relatively low sensitivity • Labour intensity of new technologies (measured as jobs per GW capacity); • baseline rates of GDP growth • Relatively high sensitivity • Recycling options of carbon tax revenues (income tax, VAT reduction, direct lump sum transfer to households); • Fossil fuel prices (oil price depends partly on the level of decarbonisation ambitions of the EU trading partners); • Investment crowding out effects