Download
1 / 22
230 likes | 566 Views
China FDI and Economic Growth. Dr. Wi Saeng Kim Hofstra University 4/25/07. China 1. Economic growth 2. FDI inflows 3. Impacts on global economy 4. Imports 5. Energy consumption 6. Steel production 7. Capital outflows. FDI:Fountainhead of China’s Economic Growth.

E N D
ChinaFDI and Economic Growth Dr. Wi Saeng Kim Hofstra University 4/25/07
China1. Economic growth2. FDI inflows3. Impacts on global economy4. Imports5. Energy consumption6. Steel production7. Capital outflows
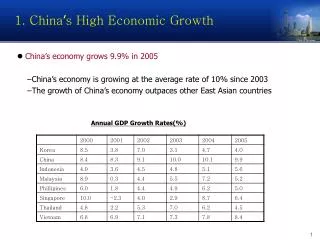
FDI:Fountainhead of China’s Economic Growth • China has grown rapidly over the last 25 years from a very lowincome level. • Average annual GDP growth 1980-2002: 9.5 percent • Per capita GDP rose from about $300 in 1980 to $1000 in 2002 • Output = ƒ (capital, labor) • FDI brought in the capital and technology • Capital financing →foreign debt • →Foreign direct investment • China selected FDI
World GDP Ranking in 2005 List by the World Bank, 2005
Inward FDI stock as a percentage of Gross Domestic Product Source: UNCTAD
Inward FDI Flows, by Economy Source: UNCTAD
Inward FDI Flows, by Economy Source: UNCTAD
Japanese direct investment flow into China, 1996-99 $ US Billions or Percent Source: Japan External Trade Organization (JETRO)
US stock and flow of direct investment to China, 1996-99 $ US Billions or Percent Source: US Department of Commerce, Bureau of Economic Analysis (BEA)
FDI in China, By region Northeastern : 6.42% Northern : 11.02% Western : 1.98% Coastal : 71.28% Southern : 4.54% Southeastern : 4.76% Source: World Factbook
Inward FDI flows as a percentage of Gross Fixed Capital Formation Source: UNCTAD
Imports Ranking by countries Source: The World Factbook
China’s market share in G-3imports from china divided by total imports • 80 90 00 01 02 • Japan 3.1 5.1 14.5 16.6 18.3 • US 0.5 3.2 8.6 9.3 11.1 • EU 0.7 2.0 6.2 6.7 7.4
Current account balance, in 2005 Source: The World Factbook
Energy Consumption Energy Consumption (Quadrillion Btu), 1980-2004 Source: Energy Information Administration
World Steel Production Source: IISI
World Steel Consumption Source: IISI
Capital outflow from ChinaFDI outflow Ranked by total value of investment during 1979-2003 Source: Ministry of Commerce
Foreign Holdings of U.S. long-term debt securities (as of 2006, $Millions) Source: U.S Department of the Treasury
Marketable U.S. Treasury 84 89 94 00 02 03 04 05 foreign holdings % 13.5 22 19.4 35.2 40.7 45.5 50.8 51.7
Capital flow cycleChina receives FDI (capital and skills)→economic growth→commodity consumption →imports increase→surplus of trade balance→invest in foreign securities→lower interest rates in the USA