Download

1 / 17
170 likes | 328 Views
Developing Genetic Barcoding for use in Water Quality Studies. Charles S. Spooner U.S. Environmental Protection Agency National Water Quality Monitoring Council December 10, 2006. Perspectives. Biology is of increasing interest in defining water quality

E N D
Developing Genetic Barcoding for use in Water Quality Studies Charles S. Spooner U.S. Environmental Protection Agency National Water Quality Monitoring Council December 10, 2006
Perspectives • Biology is of increasing interest in defining water quality • Taxonomy has been a part of EPA, USGS water data systems • NODC Dataset • Integrated Taxonomic Data System (I T I S) • Council’s Data Elements ( WQDE) • EPA Substance Registry System • WQX Schema described yesterday • Data systems only want clear records of what was counted
Bioassesments State Water Use Designations: Aquatic Life Support Uses correlations of species to water quality through species tolerance values and trophic guides Evaluate the incidence and abundance of aquatic fauna as indicators of aquatic ecosystem condition Involves field collection, subsampling, sorting, and identification by morphological traits by a taxonomist in a lab
Inherent Problems WithMorphology • Reliance on a small and dwindling pool of taxonomic expertise in morphological taxonomy • Concerns about morphological assessments • Consistency (accuracy) • Taxonomic resolution (precision) • Time and cost associated with manual sampling, sorting, and identifying organisms • Roughly 7 labor hours and $250 in supply costs per 100 specimens
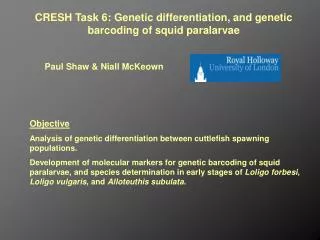
The Research Basis • Research in the 1980 established species tolerance values and trophic guides to allow the use of fish and macro-invertabrates as water quality indicators • EPT Taxa are three sensitive genera • In 2003, researchers at the University of Guelph in Ontario, Canada, proposed “DNA barcoding” as a way to identify species. Barcoding uses a very short genetic (but standard) sequence from a standard part of the genome • EPA used DNA to identify species in ballast water and to understand environmental determinants of fish population structure
The AMI Project EPA’s Advanced Monitoring Initiative began in 2007, using Maryland as the test state (1) determine whether DNA barcoding can improve efficiency of bioassessment and (2) to use this information to determine how to most efficiently incorporate DNA barcoding into state bioassessment programs.
Project Design Reference Barcode Database EPA Maryland DNR If taxonomic agreement Smithsonian + = Adult Voucher Specimens EPA-contract Lab Guelph If taxonomic disagreement Taxon Experts Morphology DNA Repeatability Accuracy Precision Cost Repeatability Precision Cost Species Description
Process • A leg is sub sampled from the voucher and placed into a 96 well extraction block • DNA is extracted from the subsample • A robot that can process 384 samples in six hours • Amplification of the barcode gene • Polymerase Chain Reaction; PCR • Partitions subunit 1 of the cytochrome oxidase (CO1) gene • Sequencing • Determining the composition and order of the nucleotide bases • Enter the sequences and metadata into the Barcode of Life Database • In the future: into GenBank
Bugs in the System • ~10% COI amplification failure • ~25% unacceptable sequence
Morphological Results From 2007 MBSS collection 803 specimens were sent to independent lab for identification to the lowest possible level Small percentage only identified to order or family 73.2% to genus, 22.5% to species - Reidentification in a separated lab: 6.8% disagreement in genus level identifications Main offenders: Ephemerella and Serratella, Prostoia and Ostrocerca, and Cheumatopsyche and Diplectrona
Can DNA barcodes add resolution to bioassessments? Isoperla sp. 1 n=4 Isoperla sp. 2 n=3 Isoperla sp. 3 n=3 Isoperla sp. 4 n=7 Isoperla sp. 5 n=4 Isoperla sp. n=27 Isoperla sp. 6 n=6
4 1 Genetic groups within Isoperla 4 7 7 7 4 1 116 54 1% sequence divergence 1
Conclusions Great potential to enhance bioassessments, after a reference library is formed Larger centralized effort is needed to is needed to create an EPT reference library Field and lab protocols need to be standardized
Acknowledgements US EPA Mark Bagley, Stefanie Swensen, contractor, John Martinson, S.A. Jackson, A.C. Roth, Steve Young Smithsonian Institution, Laboratories of Analytical Biology Jeffery Hunt, Andrea Ormos, Genelle Harrison, Amy Driskell, Lee Weigt Smithsonian Institution, National Museum of Natural History Terry Erwin, Oliver S. Flint Jr., David Furth Maryland Department of Natural Resources Ron Klauda, Ellen Friedman, Istvan Turcsanyi Consortium for the Barcode of Life David Schindel Canadian Barcoding Network Pia Marquardt Dynamac Corporation Ana Braam, Carrie Drake, Mandy Schable, Mike Sergeant, Ian Struewing, Charles Watson