Download

1 / 24
250 likes | 566 Views
MEASURES of. CENTRAL TENDENCY. TOPICS TO BE DISCUSSED:. Mean Median Mode. MEAN. INTRODUCTION. The mean of a sample or a population is computed by adding all of the observations. and dividing by the number of observations.

E N D
MEASURES of CENTRAL TENDENCY
TOPICS TO BE DISCUSSED: • Mean • Median • Mode
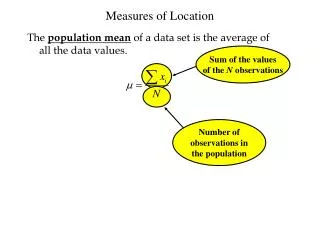
INTRODUCTION The mean of a sample or a population is computed by adding all of the observations and dividing by the number of observations. MEASURES OF CENTRAL TENDENCY: MEAN,MEDIAN,MODE
The mean (or average) is the most popular and well known measure of central tendency. It can be used with both discrete and continuous data, although its use is most often with continuous data. The mean is equal to the sum of all the values in the data set divided by the number of values in the data set. So, if we have n values in a data set and they have values x1, x2, ..., xn, then the sample mean, usually denoted by (pronounced x bar), is: MEASURES OF CENTRAL TENDENCY: MEAN,MEDIAN,MODE
This formula is usually written in a slightly different manner using the Greek capital letter, pronounced "sigma", which means "sum of...": MEASURES OF CENTRAL TENDENCY: MEAN,MEDIAN,MODE
You may have noticed that the above formula refers to the sample mean. So, why call have we called it a sample mean? This is because, in statistics, samples and populations have very different meanings and these differences are very important, even if, in the case of the mean, they are calculated in the same way. To acknowledge that we are calculating the population mean and not the sample mean, we use the Greek lower case letter "mu", denoted as µ: MEASURES OF CENTRAL TENDENCY: MEAN,MEDIAN,MODE
The mean is essentially a model of your data set. It is the value that is most common. You will notice, however, that the mean is not often one of the actual values that you have observed in your data set. However, one of its important properties is that it minimises error in the prediction of any one value in your data set. That is, it is the value that produces the lowest amount of error from all other values in the data set. MEASURES OF CENTRAL TENDENCY: MEAN,MEDIAN,MODE
An important property of the mean is that it includes every value in your data set as part of the calculation. In addition, the mean is the only measure of central tendency where the sum of the deviations of each value from the mean is always zero. MEASURES OF CENTRAL TENDENCY: MEAN,MEDIAN,MODE
Example: Arithmetic Mean of Grouped Data To calculate the arithmetic mean of grouped data, we need to extend the above table as follows: The arithmetic mean is: MEASURES OF CENTRAL TENDENCY: MEAN,MEDIAN,MODE
INTRODUCTION To find the median, we arrange the observations in order from smallest to largest value. If there is an odd number of observations, the median is the middle value. If there is an even number of observations, the median is the average of the two middle values. MEASURES OF CENTRAL TENDENCY: MEAN,MEDIAN,MODE
The median is the middle score for a set of data that has been arranged in order of magnitude. The median is less affected by outliers and skewed data. In order to calculate the median, suppose we have the data below: MEASURES OF CENTRAL TENDENCY: MEAN,MEDIAN,MODE
We first need to rearrange that data into order of magnitude (smallest first): MEASURES OF CENTRAL TENDENCY: MEAN,MEDIAN,MODE
Our median mark is the middle mark - in this case 56 (highlighted in bold). It is the middle mark because there are 5 scores before it and 5 scores after it. This works fine when you have an odd number of scores but what happens when you have an even number of scores? What if you had only 10 scores? Well, you simply have to take the middle two scores and average the result. So, if we look at the example below: MEASURES OF CENTRAL TENDENCY: MEAN,MEDIAN,MODE
We again rearrange that data into order of magnitude (smallest first): Only now we have to take the 5th and 6th score in our data set and average them to get a median of 55.5. MEASURES OF CENTRAL TENDENCY: MEAN,MEDIAN,MODE
Example: The median is the middle value of a data set and for grouped data, we can find the class that the median resides in relatively easily. In the case of the example we used for the arithmetic mean of grouped data, we can see that the median value is the average of the 20th and 21st values … there are 40 data points, an even number of data points. The median class is highlighted in the following table: MEASURES OF CENTRAL TENDENCY: MEAN,MEDIAN,MODE
The calculation of the median of grouped data is based on the following formula: L = the lower limit of the class containing the median n = the total number of frequencies f = the frequency of the median class CF = the cumulative number of frequencies in the classes preceding the class containing the median i= the width of the class containing the median MEASURES OF CENTRAL TENDENCY: MEAN,MEDIAN,MODE
Putting the numbers from the example into the formula now, we see that the median value is 10.53: MEASURES OF CENTRAL TENDENCY: MEAN,MEDIAN,MODE
INTRODUCTION • The mode is the most frequently appearing value in the population or sample. Suppose we draw a sample of five women and measure their weights. They weigh 100 pounds, 100 pounds, 130 pounds, 140 pounds, and 150 pounds. Since more women weigh 100 pounds than any other weight, the mode would equal 100 pounds. MEASURES OF CENTRAL TENDENCY: MEAN,MEDIAN,MODE
The mode is the most frequent score in our data set. On a histogram it represents the highest bar in a bar chart or histogram. You can, therefore, sometimes consider the mode as being the most popular option. Normally, the mode is used for categorical data where we wish to know which is the most common category. Mode = L + [(fm-f1) / (fm-f1)+(fm-f2)] x h where:L is the lower class boundary of modal classfm is the Frequency of the modal classf1 is the previous frequency of the modal classf2 is the next frequency of the modal classh is the size of modal class i.e. difference between upper and lower class boundaries of modal class. Modal class is a class with the maximum frequency. MEASURES OF CENTRAL TENDENCY: MEAN,MEDIAN,MODE
Example: The class containing the largest number of class frequencies is highlighted below The mid point of the modal class is 12.5 so the mode of these data is 12.5 MEASURES OF CENTRAL TENDENCY: MEAN,MEDIAN,MODE
SUBMITTED BY: Bea Jianne C. Roque Tyrone Jasper C. Piad John MaienneMangalili III-OXYGEN MEASURES OF CENTRAL TENDENCY: MEAN,MEDIAN,MODE