Post Mortem data handling and performance
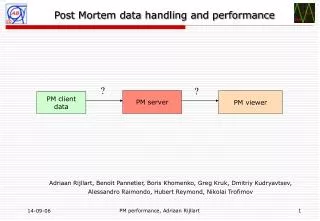
Post Mortem data handling and performance. ?. ?. PM server. PM viewer. PM client data. Adriaan Rijllart, Beno î t Pannetier, Boris Khomenko, Greg Kruk, Dmitriy Kudryavtsev, Alessandro Raimondo, Hubert Reymond, Nikolai Trofimov. Post Mortem data handling and performance. Outline.

Post Mortem data handling and performance
E N D
Presentation Transcript
Post Mortem data handling and performance ? ? PM server PM viewer PM client data Adriaan Rijllart, Benoît Pannetier, Boris Khomenko, Greg Kruk, Dmitriy Kudryavtsev, Alessandro Raimondo, Hubert Reymond, Nikolai Trofimov PM performance, Adriaan Rijllart
Post Mortem data handling and performance Outline PM system dataflow view Data model and formats Transmission Storage Conversion Access Conclusion PM performance, Adriaan Rijllart
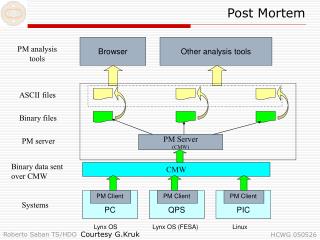
PM system dataflow view Conversion Collection Analysis and display PMD object SDDS result HWC PM viewer PC PM view PM analyser QPS PM view PM converter and data manager PIC PM view Alarms Logging Meas. Data bases PM performance, Adriaan Rijllart
PM conversion 1 and 2 Conversion Collection PMD object SDDS 1 PMC PMD file + PMX description file 2 PMX PM performance, Adriaan Rijllart
Data formatting, collection and storage (v1.0) Data model A set of conventions and rules on structuring the PM data and associated metadata Data collection and storage PM performance, Adriaan Rijllart
Data transfer speed • Test data: 1540 Kb (FGC) • Client on cfc-sr4-dl4de (LHC FIP gateway), server on cs-ccr-pm1 • 100 Mb/s connection, pure technical network PM performance, Adriaan Rijllart
PMD file conversion speed (v1.0) • Test data: 10 signal arrays of different types (length = 10000) + metadata • PMD file size = 172Kb, SDDS ASCII = 712Kb, SDDS bin = 621Kb • Converter (Java) runs on cs-ccr-pm1, all files on the local disk PM performance, Adriaan Rijllart
PMX data converter and manager PM system PMD object SDDS bin + SDDS ascii + + PM converter and data manager + + PM performance, Adriaan Rijllart
PMD file conversion speed FGC file size 400 kB, QPS file size 100 kB. (1) BinX format change of text strings into numerical codes FGC 700 ms -> 420 ms QPS 150 ms (not affected) (2) binX -> PMX transition FGC 420 ms -> 270 ms (measured for old (5 buffers) data format) QPS 150 ms -> 80 ms (3) Further optimised PMX conversion (and FGC - new format) ascii+bin -> bin only FGC 310 ms -> 100 ms QPS 70 ms -> 30 ms PM performance, Adriaan Rijllart
PM analyser and viewer PM system SDDS bin result HWC PM viewer PM analyser Panel can show PC PMA PC PMA view Interaction analysis QPS PMA Interaction view PIC PMA Alarms Logging Meas. Data bases PM performance, Adriaan Rijllart
Reading, analysis and graphing speed LabVIEW on Linux, data read from PMserver using NFS FGC: FGC File reading speed ASCII SDDS, size 1.8 MB, 200 ms. FGC Creating text table with 10 columns and 21000 lines, 4 s. FGC Creating graph with 6 traces 21000 points each, 1 s. QPS: QPS File reading, 500 kB, analysis and output table + graph, 2 s. PIC: PIC (logging DB) reading, size 270 kB, 4.1 s. analysis and table + graph, 15 s. PM performance, Adriaan Rijllart
PM multi step analysis sequence Flags Analog signals Global signals Final IST analysis PC PMA PC PMA QPS PMA QPS PMA PIC PMA PIC PMA Express interaction analysis Global analysis IST conclusion Full PM conclusion Express PM conclusion Time PM performance, Adriaan Rijllart
PIC Data Analyser Automatically recognised events within time window. Results displayed in colour. Three events are shown in plots. Events can be selected and the other “scroll” down. PM performance, Adriaan Rijllart
1 2 3 4 2. View of QPS signals to see that the system triggered and the quench heaters fired. 3. Automatic analysis of the quench heater discharge (log scale) showing the results. 4. Automatic analysis of the event with “passed/not passed” indication. QPS data analyser Example: Automatic verification of the QPS tests for quality assurance. 1. The quench detection signal gets driven over the 100 mV threshold. PM performance, Adriaan Rijllart
2. Show table 3. Show plot PC Data Analyser 1. Select event PM performance, Adriaan Rijllart
HWC PM analyser HWC PM analyser/viewer System selection PMA System Files Alert QPS PC PIC BI RF BT PM performance, Adriaan Rijllart
Extract from HWC test procedure HCP-0002 Circuit types Action Reaction required Result of PM analysis Quench heater error OK Quench detector error PM performance, Adriaan Rijllart
HWC PM test application PM performance, Adriaan Rijllart
PM project: Milestones • June ‘06: Data analyser & viewer for QPS, PIC and PC data -> We are late with PC analysis: new buffers, new browser requirements, new directory structure, … • Sept. ‘06: Extended PM data storage model for new clients -> Model implemented, testing by BI. • Sept. ’06: Dry run, correlation of QPS, PIC and PC data -> Test with Sequencer done in August, but more work is needed to integrate systems analysis into HWC. • Oct. ‘06: PM system scaling test, including BI, BT and RF • Nov. ‘06: HW commissioning analysis, as defined in LHC-D-HCP-0002 • 6. During‘07: Analysis for Beam Commissioning • -> Discussions about XPOC started PM performance, Adriaan Rijllart


![[Project Name] Post-Mortem](https://cdn0.slideserve.com/1273592/project-name-post-mortem-dt.jpg)