Site Description
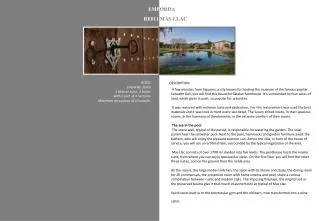
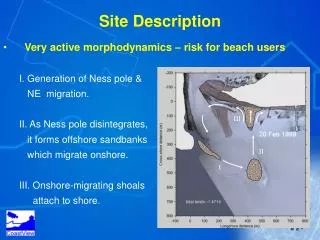
This study examines the active morphodynamics at the Ness Pole area, focusing on the risk posed to beach users due to changing sediment transport patterns. The disintegration of the Ness pole leads to the formation of offshore sandbanks that migrate onshore, creating unpredictable coastal dynamics. By simulating various wave heights, directions, river discharge variations, and tidal changes, the research aims to characterize these risks and generate a customizable risk map for local managers, ultimately enhancing beach user safety.

Site Description
E N D
Presentation Transcript
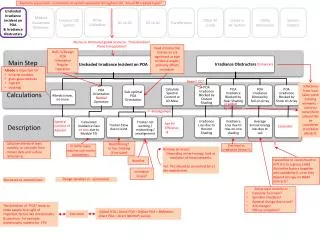
III II I Site Description • Very active morphodynamics – risk for beach users • I. Generation of Ness pole & • NE migration. • II. As Ness pole disintegrates, • it forms offshore sandbanks • which migrate onshore. • III. Onshore-migrating shoals • attach to shore.
Stage II Stage I Shore-attached sand bar h c Offshore sandbank Key a e (North) B Limit of intertidal region Subtidal contour (-3 m ODN) l Sediment transport pathways e l e n n n n a Dry land a h h C C s s s e s c e 200 m c c Scale: c A A Offshore sandbank (South) / Ness pole Ness Head Stage III Offshore sandbank h (North) c a e B l e n n a s d h n a S C t t a r p s S s e c c A Offshore sandbank (South) / Ness pole Methods • Extract morphology from video ( 6 stages of the updatedted version of cycle)
Expected results • Simulations for: • A range of wave heights and directions • Spring and neap variations • A range of river discharge • Characterise risks and produce a chart explaining them • Generate a risk map template for the manager to modify.