Download

1 / 26
260 likes | 415 Views
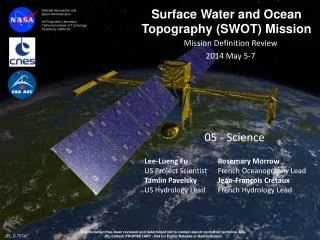
National Aeronautics and Space Administration Jet Propulsion Laboratory California Institute of Technology Pasadena, California. Surface Water and Ocean Topography (SWOT) Mission. Mission Definition Review 2014 May 5-7. 05 - Science. Lee-Lueng Fu US Project Scientist Tamlin Pavelsky

E N D
National Aeronautics and Space Administration Jet Propulsion Laboratory California Institute of Technology Pasadena, California Surface Water and Ocean Topography (SWOT) Mission Mission Definition Review 2014 May 5-7 05 - Science Lee-Lueng Fu US Project Scientist Tamlin Pavelsky US Hydrology Lead Rosemary Morrow French Oceanography Lead Jean-François Crétaux French Hydrology Lead This document has been reviewed and determined not to contain export controlled technical data. JPL/Caltech PROPRIETARY - Not for Public Release or Redistribution. JPL D-75747
SWOT Science Background • SWOT was recommended by the 2007 NRC Decadal Survey as a wide-swath altimetry mission for addressing key science objectives in land hydrology and submesoscale oceanography. • SWOT science objectives have been formulated by an international Science Working Group via 8 meetings since 2007, plus an AGU Town hall meeting. • The results of these meeting are summarized in a comprehensive report (228 pp) covering hydrological and oceanographic objectives, measurement techniques, and a preliminary mission design. ( http://swot.jpl.nasa.gov/files/SWOT_MSD_final-3-26-12.pdf) • This report serves as the basis for the mission’s science requirements. • The mission’s Science Definition Team has met 3 times since inception in 2013 to update and finalize the science requirements.
Oceanographic Objectives • Ocean topography is an analog of atmospheric surface pressure: ocean currents flow around the highs and lows of ocean topography, like winds blow around the highs and lows of surface pressure. • Satellite altimetry over the past 25 years has made measurement of sea level change at scales larger than 200 km: ocean gyres, El Nino, sea level rise, large eddies. • Ocean currents and eddies at scales shorter than 200 km, containing most of the kinetic energy of the ocean, play key roles in the transport of heat, carbon and nutrients. They affect climate via modulation of sea surface temperature and heatflux, as well as the oceanicuptake of carbonfrom the atmosphere. • Ocean currents and eddies at these short scales are also important to coastal ocean processes of importance to societal applications. • The primary oceanographic objectives of the SWOT mission are to observe the ocean mesoscale and submesoscale circulation at spatial resolutions of 15 km and larger, providing the missing link between 15 and 200 km for ocean climate studies.
Targeting the dynamics of the smallest scales of ocean currents Ocean Topography Sea Surface Temperature 2000 km Sea Surface Temperature 200 km SSH is needed for dynamics
The limit of resolution of Jason-1/2 A snapshot of (sea surface height)SSH from Jason-1/2 Drop in energyof 2-D gridded SSH spectrum (blue) vs alongtrackspectrum(red) at 200 km Indicates the mappingresolutionwith nadir altimeter constellations. Power density SWOT will extend the measurement down to 15 km 1,000 km 100 km 10 km
Submesoscale Ocean Processes The missing information at the submesoscale is important for predicting the dispersal of pollutants in the ocean. 15 km eddies
Oceanographic Performance Requirement • This plot is based on analysis of historical altimetry data for estimating the SSH signals. • The data base and analysis are improved from the MCR version.
Simulated SWOT Ocean Observations 800 km 200 km 600 km
Need of the Nadir altimeter • The long-wavelength accuracy of the SSH measurement is expected higher for the altimeter than KaRIn. • By combining the two measurements simultaneously, a consistent measurement from short (KaRIn) to long wavelengths (altimeter) can be obtained. • Strong heritage of error analysis from nadir altimetry (T/P, J1, J2, Saral/AltiKa, …) • Calibration and validation of SWOT in setting the standard for the next generation altimetry missions to continue the climate data record of sea level and improve its resolution and coverage.
Impact of long length scales in oceanography Without nadir altimeter Without nadir altimeter Without nadir altimeter
Hydrologic Objectives • Surface water in rivers, lakes, and wetlands uniquely integrates spatially distributed signals from all components of the terrestrial water cycle. As such, measuring surface water storage and fluxes reveals spatial and temporal patterns in the water cycle. • Current global observation capabilities of surface water are insufficient to characterize the present-day water cycle: • The flux of water through rivers is known to approximately +/-20% at large scales but not at scales small enough to reflect the dominant processes governing the water cycle. • Water storage can only be measured in the largest lakes and reservoirs, but most variability in water storage is in smaller water bodies. • There are no consistent global measurements of water storage in wetlands • The hydrologic science measurement objectives for SWOT are: • To provide a global inventory of all terrestrial surface water bodies whose surface area exceeds (250m)2 (lakes, reservoirs, wetlands) and >10km long river reaches whose width exceeds 100m (requirement). • To measure the global patterns of change in storage in terrestrial surface water bodies and river discharge at sub-monthly, seasonal, and annual time scales.
Understanding the Water Cycle • To understand how climate change will affect the water cycle (both average and extreme events), we need to understand how precipitation is partitioned into evapotranspiration and runoff. • Our ability to accurately partition precipitation is limited, in part because we lack globally consistent runoff data to constrain models. • SWOT must provide runoff data at sufficiently fine spatial scales to constrain regional patterns. Current models simulate very different patterns of runoff
SWOT Performance Requirements: Rivers Width to drainage area translation: 50 m ~ 10,000 km2 100 m ~ 50,000 km2 170 m ~ 150,000 km2 SWOT will give us globally consistent observations of river height and discharge and these spatial scales for the first time. Goal Threshold Baseline (from Pavelsky et al., in review, J. Hydrology)
SWOT Performance Requirements: Rivers • Inundated Area/River Width: • 15% error for 100 m wide rivers over 10 km reach (baseline) • 15% error for 170 m wide rivers over 10 km reach (threshold) • Water surface elevation/height: • 10 cm error for 1 km2 area and 25 cm error for between (250 m)2 and 1 km2 (baseline) • 11 cm error for 1 km2area (threshold) • Water surface slope: • 10 mraderror for 100 m wide river over 10 km (baseline) • 20 mrad error for 100 m wide river over 10 km (threshold) Allen et al., in review, GRL
Discharge Product • Discharge is not directly measured by either stream-gauges or from satellite measurements • For both cases, discharge is estimated from other measurements (e.g., rating curves for gauges) • SWOT will provide estimates of discharge based on multiple SWOT measurements (stage, slope, width), and the observation of river dynamics over the SWOT lifetime (with complimentary, but not required, in situ data). • Discharge performance will be characterized. • Two open community meetings of hydrologists have approved the following plan: • There are many regions of the world where no discharge measurements are openly available or available at all, making the global assessment of river discharge currently impossible. • Given the peculiarities of river morphology and dynamics and discharge basin area, it is not possible to arrive at a global discharge requirement. • Global estimates of discharge are a unique SWOT product and will be revolutionary for the community, as long as the discharge error is characterized • Error characterization plans are acceptable: USGS and stream gauges in France are available for comparison to SWOT discharge. AirSWOT campaigns will be valuable for understanding discharge algorithm performance across scales.
SWOT Simulated Discharge for the Sacramento River • Sacramento River model at Colusa (31,300 km2) with SWOT temporal sampling & errors for seven orbit cycles used to generate SWOT obs. • Discharge calculated using Manning’s equation using SWOT observations and two unobserved parameters, which are calculated as in Durand et al.[2014] • Discharge RMSE: 9%. Formal uncertainty: 30%. Error budget indicates this is mostly due to uncertainty in unobserved parameters True runoff for Sacramento River: 8.5 km3/yr Estimated runoff: 8.1 km3/yr (error = -5.6%) (from M. Durand, SWOT SDT)
SWOT Lake Science: Storage and Connectivity The hydrologic connectivity of rivers, lakes, floodplains, and wetlands is hugely important for hydrology, biogeochemistry, and ecologybut is very hard to assess using current technology.SWOT will allow us to track hydrologic connectivity among water bodies. ??? Estimated Connectivity of Lakes in the Peace-Athabasca Delta, Canada from MODIS (Pavelsky and Smtih, 2008). Storage of water in lakes is a fundamental part of the global water cycle, yet we have no meaningful measurements of the dynamics of lake storage beyond the largest lakes (from altimetry). SWOT will provide lake water storage measurements that will fill in a significant gap in our understanding of how water moves through the Earth system.
SWOT Performance Requirements: Lakes • Nadir altimeters miss more than 60% of lakes and can only observe area >100km2 thus measure only 15% of the global lake storage change • SWOT is global coverage and will observe area >250mx250m thus measure 65% of the global lake storage change Current capabilities ~15% Cumulative lake storage change (%) New capability ~65% 10km x 10km 250m x 250m 1km x 1km Lake area (km2) Biancamaria et al., 2010
SWOT Performance Requirements: Lakes • Inundated Area: • 15% accuracy for lakes larger than (250 m)2 (baseline) • 15% accuracy for lakes larger than 1 km2 (threshold) • Lake Water Surface Height: • 10 cm accuracy for lakes larger than 1 km2 and 25 cm accuracy for lakes between 1 km2 and (250m)2 (baseline) • 11 cm accuracy for lakes larger than 1 km2 (threshold)
Measurements vs. Estimates of Floodplain Inundation and hydraulics Floodplain flow is a complex pattern of changing water elevations. Across nearly every floodplain and wetland in the world, these water elevations are estimated based on gauges. Because gauges are located in the rivers and not the floodplains, water heights extrapolated from gauges and across the wetlands, do not match the actual elevations. The bottom figure is essentially useless for understanding actual water flow represented by the top figure. From interferometric JERS-1 SAR Alsdorf et al., GRL 2007
Synergistic Objectives (not driving mission design) Ice Sheet Topography Sea Ice Freeboard Sea ice thickness reflects the energy balance of the growth and decay of sea ice with great importance to climate change and societal applications. The melt of ice sheet is a major source of sea level rise from climate change. Ocean Bathymetry The high precision of SWOT measurement of sea surface height coupled with the full spatial coverage will make significant advance in the knowledge of ocean bathymetry with advances in both science and applications.
SWOT Science Program • The Science Definition Team (SDT) has been jointly established by NASA and CNES. Three SDT meetings have been held (January and June, 2013, January 2014). Next meeting planned forJune 2014, in Toulouse, France. • The SWOT science program is being performed by the SDT through 2015 and will be continued by the Science Team working closely with an informal Project Science Team (a compendium of projects useful to SWOT but funded by project or non-SWOT ROSES and TOSCA). • The mission’s science teams will be led by the Program/Project Scientists and Team Leaders appointed by the Project and NASA/CNES throughout the mission.
Phase B Plans • Coordinate the SDT to develop science analysis, simulations, and studies to support the preparation for the PDR. • Develop the Science Management Plan that captures the long-term organization, support, and activities for the science teams. • Work with the SDT to develop cal/val and algorithm plans. • Coordinate with partners (CNES, CSA) on joint mission science development activities. • Coordinate with NASA and CNES on the formation of the mission’s Science Team starting in 2016.
Summary • SWOT science objectives have been formulated by an international Science Working Group (SWG) via 8 meetings since 2007, plus an AGU Town hall meeting. • The results of the SWG have been summarized in a comprehensive report covering hydrological and oceanographic objectives, measurement techniques, and a preliminary mission design. • The mission’s Science Definition Team (SDT) has been established. • The SDT has met three times to refine and finalize the mission’s science requirements for the MDR. • The response to the SRR RFA has been accepted and the RFA is closed • Over 70 publications on SWOT science studies. Project Science is ready to proceed to Phase B
Orbit Requirements • Global coverageand more frequent sampling dictates a compromise in orbit repeat period of 21 days • Inclination between 74 and 80 degrees toachieve non sun-synchronous orbit to minimize tidal aliasing and to ensure coverage of major water bodies on land. • 1 day repeat period during the initial cal/val phasefor fast sampling to achieve the cal/val objectives and study rapidly changing phenomena.