Download
1 / 21
210 likes | 331 Views
This document outlines the comprehensive framework of the UK healthcare data landscape under the NHS, led by the GPRD and associated research initiatives. It highlights the integration of longitudinal health data, including electronic health records, hospital statistics, and cancer registries, facilitating in-depth analyses for drug safety and efficacy. The innovative use of the Yellow Card system for adverse drug reaction reporting is presented, alongside advancements in hypothesis generation leveraging real-world data. A detailed examination of risk-benefit assessments in clinical trials emphasizes the commitment to improving patient outcomes through enhanced healthcare analytics.

E N D
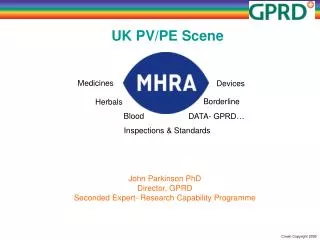
John Parkinson PhDDirector, GPRDSeconded Expert- Research Capability Programme Medicines Devices Borderline Herbals Blood DATA- GPRD… Inspections & Standards UK PV/PE Scene
United Kingdom UK Health Care • NHS- 99.9% of people • Registered with one GP practice • Transfer to another with longitudinal record GP2GP • All but 2 practices (9000+) have e- records • Essentially only 4 GP IT systems • Problem based • And or Record based • Many are paperless or paper light • GP is gatekeeper • Apart from emergency care, no access anywhere else • Key secondary and other care data flows back to GP who enters into EHR • Except when in hospital/day care- all drugs via GP • Unique NHS ID- NHS# 10 numeric • BUT • 4 Health Services • England 80%, Scotland 10%, Wales, 4%, NI 3% • Research Capability Programme- England - • Connecting for Health (CfH)- English NHS IT project (£12 Billion) • UK Clinical Research Collaboration (UKCRC) • Office of Central Coordination of Health Research (OSCHR) • National Institute for Health Research (NIHR)
United Kingdom Drug Exposure • 95% of all drugs Rxed by GP • Primary care • Secondary care recommendation • Post hospitalisation • 5% administered in hospital setting • In Hospital • Cancer Day care • Some highly specialist drugs • 2010 person level data • Dispensed data staring 2010
United Kingdom Events • GP records • All Events- (READ) • Consultations • By email, letter, phone • Primary hospital discharge summary (TEXT to READ) • GPRD (5% sample UK) 60 billion events over 23 years • Hospital Episode Statistics • All events (ICD10) • 99.9% cover • Death data • 90-95% in GP record • Fully in central linkable record
United Kingdom UK Health Research….Datatoday • GPRD • 5% UK sample • High quality longitudinal data • 2.8 billion events (41M BMI), 12 million n ever, 3.5 M active • Linked to • Full admin Hospital data (HES) ICD9, OPCS4, dates by ward • Full detailed CVD record (MINAP) • Full Cancer registry data • Central Death data • 2010 Hospital and day care Rx (admin)
OSCHR United Kingdom SHIP 8% 5M NI 3% RCP 80% 50+M SAIL 4%
ENGLAND RCP • Max collection of Primary Care data • Some in near real time • Essentially FULL all person EHR • All Lab tests • All life style • All events • Linked with • Central Death data (99.9%) • Central Hospitalisation (99.9%) • Key disease registers (40) • MINAP Cancer Implants • BIOBANK (500,000) • Central single point Clinical Trial system 50+Million Research Capability Programme Health Research Support Service
United Kingdom UnderlyingPrinciplesofPV/PE
United Kingdom SIGNALS Hypothesis Generation 1st 3rd 2nd Hypothesis Strengthening Hypothesis Testing Longitudinal Data SIGNALS Longitudinal Data PHASE 3 CT data
United Kingdom N exposed Power for HYP. Testing EPI study 10,000s 1000s Exposure required for Hyp. Strengthening 100s 0 Yr4 Yr2 Yr3 Yr1 Years post launch
B B A United Kingdom Data Mining and Hypothesis Testing in One dataset Random Split =
United Kingdom UK Hypothesis generation SIGNALS • Yellow Card system- paper based • Doctors • Health Care Professionals • Patients • eYellow Cards • Fully embedded within EHR systems • Expert system • Auto-filled in with key details • Comments added • Sent in over NHSnet • “Conversation” possible
United Kingdom UK Hypothesis Strengthening Longitudinal Data SIGNALS PHASE 3 CT data • On day 1 of a new product • RR from Phase 3 studies modelled with real world data • Uses ExEtrac methodology • Better contextualisation of signal data
Clinical Trial Real World Risk Benefit United Kingdom Outline methodology ExEtrac • Relevant RRs from Phase 3 trials • Real/observed incidence rates –on treatment • Derived real world “non Treatment” rates • Attributable (absolute rate)= treatment R- non T R • (Causal) • What if true • Model uncertainty • Weighted Risk to Benefit • QOL can also be involved Relative Absolute
Clinical Trial Real World Risk Benefit Excess number of cases in 10,000 HRT users (age 50-59) Benefits Risks Relative Absolute
Clinical Trial Real World Risk Benefit Excess number of cases in 10,000 HRT users (age 70+) Benefits Risks Relative Absolute
United Kingdom Risk-benefit acceptability curves by age (5 year HRT use) % population 40-49 50-59 60-69 70+ Risk Minimisation Plan Risks Benefits Cases/10,000 [5yrs]
United Kingdom Randomisation in everyday clinical care • Confounding/ channelling • Possible because of eHR • Modified IT system for auto-prompt • Randomisation across web • Data collection in EHR • Wait for events • Low cost- big Ns possible • 3 studies in GPRD network, funded and in final planning
United Kingdom Summary • Encourage more GP, HC professionals to report ADRs- Yellow Cards • Auto- e Yellow cards • Full EHR/ linkable data • Better contextualisation of YC data • Risk Management – new products • ExEtrac methodology • Earlier licensing- full n follow up • Rando. In every day care • Full exposure record including Phase 3 CTs.
Quality United Kingdom Clinical Trial Relative Risk Benefit Absolute Real World