Download
1 / 18
180 likes | 295 Views
The Effects of Site and Soil on Fertilizer Response of Coastal Douglas-fir. K.M. Littke, R.B. Harrison, and D.G. Briggs University of Washington Coast Fertilization Meeting February 15, 2012. Introduction.

E N D
The Effects of Site and Soil on Fertilizer Response of Coastal Douglas-fir K.M. Littke, R.B. Harrison, and D.G. Briggs University of Washington Coast Fertilization Meeting February 15, 2012
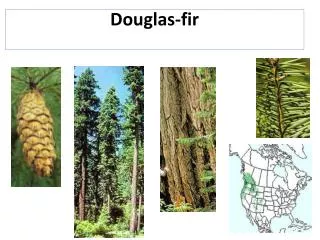
Introduction • Douglas-fir grows on many of the diverse soil types of the coastal Pacific Northwest region • Distinctive site, soil, and nutrient characteristics between different soil parent materials • Douglas-fir productivity has been related to site, soil, water, and nitrogen characteristics • Urea fertilizer has been found to increase Douglas-fir growth response 70% of the time • Many factors involving water and nitrogen availability have been investigated as predictors of fertilizer response • No consistent predictors have been found
Objectives • Determine the best predictor variables of Douglas-fir fertilizer growth response using boosted regression trees (BRT) • Relate BRT results to actual values • Map BRT results to identify spatial relationships in fertilizer response Definitions: • Predictor variables: Climate, site, soil, water, nitrogen, foliar, and productivity characteristics
Study Sites • 60 paired-tree Douglas-fir fertilization installations • At or near canopy closure (14-28 years old) • Similar spacing (750 trees per ha) • Red markers – Glacial parent material • Green markers – Sedimentary parent material • Blue markers – Igneous parent material
Paired-tree Design • 48 dominant/co-dominant Douglas-fir trees chosen on a 15-meter grid • Trees paired by most similar diameter at breast height and crown height • 12-20 pairs per installation • One tree per pair fertilized with 224 kg N ha-1 as urea • One soil pit sampled per installation to one-meter
Variables Site Characteristics • Stand Density • Slope • Elevation • Aspect • Parent Material and Region Climate Characteristics • Growing Degree Days • Monthly Temperature and Precipitation • Seasonal Temperature and Precipitation • Precipitation as Snow Soil Characteristics • Effective Depth • A Horizon Depth • Sand (5 & 50 cm) • Clay (5 & 50 cm) Two-year Tree Fertilizer Response • Basal Area Response (%) • Height Response (%) • Volume Response (%) Foliar Characteristics • Foliar Nitrogen Concentration • 100 Needle Area Soil Water • Lowest Soil Moisture (5 & 50 cm) • Plant Available Water (5 & 50 cm) Soil Nutrients • Forest Floor C:N Ratio • Soil C:N Ratio • Total Soil Nitrogen • Soil Base Saturation
Boosted Regression Trees • Improves model accuracy over regression trees and multiple regression • Combination of regression trees and machine learning • Produced 1000 simple trees that are combined to form each model • Found six best variables for basal area, height, and volume growth response Predictor Response Response Response Splits Split Predictors x 1000 = Low Response High Response Response Response Response Predictors
Results: BRT Partial Dependence Plots • Effect of predictor variables keeping other predictors average • Fitted function • Shows the effect of the predictor variable on the response variable • Centered around the mean • Relative influence shown for each predictor (%) Forest Floor C:N Ratio (23%) Growing Degree Days (18%) Basal Area Mean Annual Increment (cm2/year) (18%) February Precipitation (mm) (17%) April Temperature (C) (14%) Base Saturation (%) (9%)
Results: Fertilizer Basal Area Response (%) Model • 63% deviance explained R2 = 0.62 • Basal area response to fertilization increased with forest floor C:N ratio, growing degree days, and February precipitation • Negatively related to basal area mean annual increment, April temperatures, and base saturation Forest Floor C:N Ratio (23%) Growing Degree Days (18%) Basal Area Mean Annual Increment (cm2/year) (18%) February Precipitation (mm) (17%) April Temperature (C) (14%) Base Saturation (%) (9%)
Results: Fertilizer Height Response (%) Model • 51% deviance explained R2 = 0.51 • Fertilizer height response decreasedwith basal area and volume mean annual increment, June temperature, and February precipitation • Positive influence of summer precipitation • Low- and high ranges of soil clay content also yielded greater height response Basal Area Mean Annual Increment (cm2/year) (24%) June Temperature (C) (19%) February Precipitation (mm) (18%) Summer Precipitation (mm) (15%) Clay Content (%) (16%) Volume Mean Annual Increment (cm3) (8%)
Results: Fertilizer Volume Response (%) Model • 77% deviance R2 = 0.75 • Volume growth response to fertilization positively related to May precipitation, forest floor C:N ratio, and growing degree days • Negatively related to basal area mean annual increment and April temperatures • Low and high February precipitation led to greater volume response Basal Area Mean Annual Increment (cm2/year) (27%) April Temperature (C) (19%) May Precipitation (mm) (14%) Forest Floor C:N Ratio (14%) Growing Degree Days (13%) February Precipitation (13%)
How do we interpret this model? • Volume response • Find the range of the predictor variable that yields an above average response. • Used 60 installations that formed the model • Determine if the stand meets each predictor criteria (0 or 1). • Multiply each criteria ranking by the relative influence of the predictor. • Total all predictors to determine the model criteria for that stand Predictor Criteria 1 0 1 0 0 1 27% 19% 14% Relative Influence = 0 1 0 1 1 0 1 14% 13% 13%
Example: = 81/100 81% of the criteria This stand should have a high probability of responding to fertilization Three Criteria Levels: > 66% = High Response 33-66% = Medium Response < 33% = Low Response * 1 * 1 * 0 + 1 * 27% 0 * 19% + 1 * 14% * * * 1 1 1 + + 1 * 14% 1 * 13% 1 * 13%
Model Criteria and Response Differences • Installations with less than 1/3 of the model criteria had significantly lower response. • High model criteria significantly separated the installations with the greatest fertilizer response.
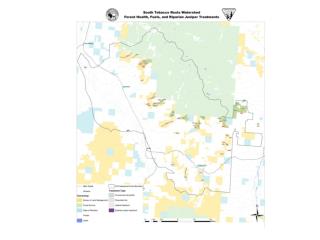
Mapping Predictor Criteria • Inverse distance weighting of each predictor variable • Separated by predictor criteria (0 or 1) • All six predictor variables mapped • Intersected different predictor criteria polygons to produce polygons with unique model criteria • Combined polygons into low, medium, and high criteria • Spatially joined installations with the model criteria polygons
Mapping Model Criteria • High variability in response in some areas • Northern Vancouver Island and southeastern Oregon have the highest model criteria • Significantly greater fertilizer volume response on high mapped model criteria
Discussion • Basal area mean annual increment was the most important predictor of fertilizer growth response. • Less than 23 cm2/year more likely to response to fertilization • Basal area and volume response was positively related to forest floor C:N ratio (>30) • Height response was not related to forest floor C:N ratio • Greater response on stands with low April temperatures, high May precipitation, and low and high February precipitation • Could help narrow down stands that will respond • Boosted regression tree models translated model criteria for installations with low, medium, and high fertilizer response • Mapping of model criteria identified hot-spots of fertilizer response in northern Vancouver Island and southeastern Oregon
Questions? • Thanks to: • Stand Management Cooperative • Center for Advanced Forestry Systems • Agenda 2020