Download
1 / 22
220 likes | 619 Views
Labor demand curve tells us how much labor firms want to hire at each employer wage Labor supply curve tells us how much labor people want to work at each employee wage How much labor actually hired and worked?. Review of Curves. Employer wage. L(D). Qty. of labor demanded. Employee wage.

E N D
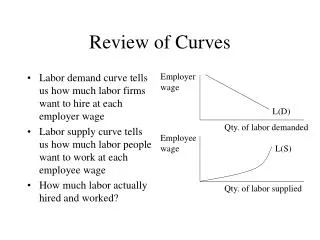
Labor demand curve tells us how much labor firms want to hire at each employer wage Labor supply curve tells us how much labor people want to work at each employee wage How much labor actually hired and worked? Review of Curves Employer wage L(D) Qty. of labor demanded Employee wage L(S) Qty. of labor supplied
Amount of labor actually worked, the quantity of labor transacted, can be found using the L(S) and L(D) curves together. When employer wage is equal to employee wage, the labor demand and labor supply curves can be drawn on the same axes. Labor Market Equilibrium L(S) Employer wage = Employee wage L(D) Qty. of labor demanded, Qty. of labor supplied
The wage at which the L(S) and L(D) curves cross is called the equilibrium wage, designated W* on the graph at right. It is so called because it is the wage to which we can expect a free labor market to converge. Labor Market Equilibrium L(S) Wage W* L(D) Qty. of labor demanded, Qty. of labor supplied
Suppose the actual wage is above the equilibrium wage, like W(hi). At W(hi), quantity of labor supplied is greater than quantity of labor demanded. Amount of labor people wish to work is more than amount of labor that firms wish to hire. Bids the price of labor, the wage, downward to W*. Labor Market Equilibrium L(S) Wage W(hi) W* L(D) L(D) < L(S)
Suppose the actual wage is below the equilibrium wage, like W(lo). At W(lo), quantity of labor demanded is greater than quantity of labor supplied. Amount of labor firms wish to hire is more than amount of labor that people wish to work. Bids the price of labor, the wage, upward to W*. Labor Market Equilibrium L(S) Wage W* W(lo) L(D) L(S) < L(D)
Suppose the actual wage is the equilibrium wage, W*. At W*, quantity of labor demanded is equal to quantity of labor supplied. Amount of labor firms wish to hire is equal to amount of labor that people wish to work. Everybody is satisfied, wage is bid neither upward nor downward, remains W* Labor Market Equilibrium L(S) Wage W* L(D) L(S) = L(D)
W* is the wage we can expect labor markets to ultimately pay. If actual wage is above W*, it is bid downward. If actual wage is below W*, it is bid upward. If actual wage is equal to W*, it remains at W*. This is why W* is called an equilibrium wage. Labor Market Equilibrium L(S) Wage W* L(D) L(S) = L(D)
The quantity of labor supplied and demanded at the equilibrium wage is the equilibrium quantity of labor transacted. Implies: if the amount of labor firms want to hire equals the amount of labor people want to work, it will also equal the amount of labor actually hired and worked. Labor Market Equilibrium L(S) Wage W* L(D) L(S) = L(D) = L
Example: the market for pharmacists in Chicago. The suppliers in this market are all Chicagoans with pharmacy degrees, who may or may not choose to work as pharmacists, if at all. The demanders are all Chicago firms that hire pharmacists: pharmacies, hospitals, etc. Labor Market Equilibrium Wage
Suppose the number of qualified Chicagoans who want work as pharmacists is determined as follows: Salary Number $40,000 1,500 $50,000 1,750 $60,000 2,000 These points, plotted, are building blocks for a labor supply curve. Labor Market Equilibrium Wage L(S) $60K $50K $40K 1500 1750 2000
Suppose the number of pharmacists that Chicago hospitals, etc. want to hire is determined as follows: Salary Number $40,000 2,250 $50,000 1,750 $60,000 1,250 These points, plotted, are building blocks for a labor demand curve. Labor Market Equilibrium Wage $60K $50K $40K L(D) 1250 1750 2250
Plot the labor supply and demand curves together. If pharmacists in Chicago earned $60K: 2,000 qualified Chicagoans want work as pharmacists Chicago hospitals, etc. want to hire 1,250 pharmacists. Surplus of pharmacists would bid pharmacist salaries downward. Labor Market Equilibrium Wage Wage L(S) $60K $50K $40K $60K $50K $40K L(D) 1250 2000
If pharmacists in Chicago earned $40K: 1,500 qualified Chicagoans want work as pharmacists Chicago hospitals, etc. want to hire 2,250 pharmacists. Shortage of pharmacists would bid pharmacist salaries upward. Labor Market Equilibrium Wage Wage L(S) $60K $50K $40K $60K $50K $40K L(D) 1500 2250
If pharmacists in Chicago earned $50K: 1,750 qualified Chicagoans want work as pharmacists Chicago hospitals, etc. want to hire 1,750 pharmacists. 1,750 pharmacists actually hired (equilibrium quantity of labor transacted) No surplus or shortage of pharmacists, salary remains $50K (equilibrium wage) Labor Market Equilibrium Wage Wage L(S) $60K $50K $40K $60K $50K $40K L(D) 1750
Recall our labor supply schedule: Salary Qty. of L supplied $40,000 1,500 $50,000 1,750 $60,000 2,000 Note 1,500 pharmacists would have worked at a $40K salary. At equilibrium, they are employed at $50K salary. Employee Surplus Wage Wage L(S) $60K $50K $40K $60K $50K $40K L(D) 1750 L
These 1,500 pharmacists, who are earning $50K but would have worked for $40K, have each gained at least $10K in surplus. An individual employee’s surplus is the wage he actually earns minus the lowest wage at which he’d have willingly worked. Employee Surplus Wage Wage L(S) $60K $50K $40K $60K $50K $40K $10K L(D) 1500 1750 L
Ex.: If Joe earns $50K but would have worked for as little as $35K, Joe’s surplus is $15K. The total surplus earned by all employees is the employee surplus. Equals area above the labor supply curve, below equilibrium wage, left of quantity of labor transacted. Employee Surplus Wage Wage L(S) $60K $50K $40K $60K $50K $40K L(D) 1750 L Employee surplus
Recall our labor demand schedule: Salary Qty. of L demanded $40,000 2,250 $50,000 1,750 $60,000 1,250 Note that hospitals, etc. would have hired up to 1250 pharmacists at $60K. At equilibrium, they are hired at $50K salary. Employer Surplus Wage Wage L(S) $60K $50K $40K $60K $50K $40K L(D) 1750 L
These hospitals, etc., which would have hired those 1250 pharmacists at $60K but instead get to hire them at $50K, gain at least $10K in surplus on each of them. Employer Surplus Wage Wage L(S) $60K $50K $40K $60K $50K $40K $10K L(D) 1250 1750 L
The surplus an employer gains from any single employee is the maximum wage the employer would have paid that employee minus the wage it actually pays that employee. Employer Surplus Wage Wage L(S) $60K $50K $40K $60K $50K $40K $10K L(D) 1250 1750 L
Ex.: If St. Mary’s Hospital hires Joe the pharmacist at $50K but would have paid up to $75K to hire Joe, then St. Mary’s gains a surplus of $25K* from hiring Joe. Employer Surplus Wage Wage L(S) $60K $50K $40K $60K $50K $40K $10K L(D) 1250 1750 L
Total surplus earned by all employers is the employer surplus. Equals area above the equilibrium wage, below the labor demand curve, left of quantity of labor transacted. The sum of employer and employee surplus is total surplus. Employer Surplus Wage Wage L(S) $60K $50K $40K $60K $50K $40K L(D) 1750 L Employee surplus Employer surplus