Download

1 / 19
190 likes | 317 Views
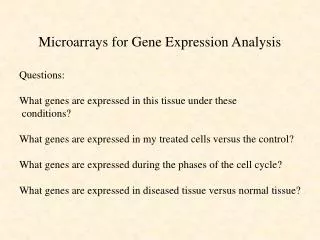
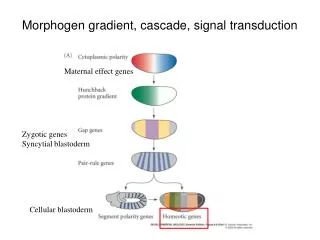
Many similarly expressed genes are coregulated by the same transcription factor(s) … Therefore, can search promoters of coregulated genes for binding sites. Genes induced by carbon starvation. Many similarly expressed genes are coregulated by the same transcription factor(s) …

E N D
Many similarly expressed genes are coregulated by the same transcription factor(s) … Therefore, can search promoters of coregulated genes for binding sites Genes induced by carbon starvation
Many similarly expressed genes are coregulated by the same transcription factor(s) … Therefore, can search promoters of coregulated genes for binding sites Genes induced by carbon starvation ORFs Upstream region
Many similarly expressed genes are coregulated by the same transcription factor(s) … Therefore, can search promoters of coregulated genes for binding sites Genes induced by carbon starvation ORFs Upstream region Similar sequence found in most upstream regions (here = CCAAT which = Hap4p binding site)
Finding sequence motifs common to a group of ‘similar’ sequences ORFs Upstream region Similar sequence found in most upstream regions How do you identify motifs in sequence data? How can you tell if the identified motif is ‘significant’? How do you find genomic examples of the identified motif?
First, representation of motifs: Position-specific Weight Matrices (PWMs aka Position-Specific Scoring Matrix, PSSM) Site 1 A G A T G G A T G G T G A T T G A T G T T G A T G G A T G G A G A T T G A T C G T G A T G G A T T G T G A T G G A T T G A G A T G G A T T G Site 2 Site 3 Site 4 Site 5 Site 6 Site 7 IUPAC consensus: W G A T G G A T N G (where W = A or T)
First, representation of motifs: Position-specific Weight Matrices (PWMs aka Position-Specific Scoring Matrix, PSSM) Site 1 A G A T G G A T G G T G A T T G A T G T T G A T G G A T G G A G A T T G A T C G T G A T G G A T T G T G A T G G A T T G A G A T G G A T T G Site 2 Site 3 Site 4 Site 5 Site 6 Site 7 PWM represents frequencies of each base at each position in the motif * G 0 1.0 0 0 0.71.0 0 0 0.40.8 A 0.4 0 1.0 0 0 0 1.0 0 0 0 T 0.6 0 0 1.0 0.3 0 0 1.00.40.2 C 0 0 0 0 0 0 0 0 0.2 0 * These days, PWM/PSSM can correspond to the frequency matrix or a likelihood matrix
Web-logo: A graphical representation of PWMs http://weblogo.berkeley.edu/ Height of the base proportional to frequency of base on that position … more specifically known as “bits” , “information content” , or “entropy”
Information content IC The least variable positions likely are important for specifying the protein-DNA interaction Therefore high information content = low sequence variation at that position. G 0 1.0 0 0 0.71.0 0 0 0.40.8 A 0.4 0 1.0 0 0 0 1.0 0 0 0 T 0.6 0 0 1.0 0.3 0 0 1.00.40.2 C 0 0 0 0 0 0 0 0 0.2 0 Information Content at position i: ICi= 2 + SPb(i) * log2(Pb(i) ) b=G,A,T,C Where Pb(i) is the probability of base b at position i If using log2, the info content is in ‘bits’
Information content IC The least variable positions likely are important for specifying the protein-DNA interaction Therefore high information content = low sequence variation at that position. G 0 1.0 0 0 0.71.0 0 0 0.40.8 A 0.4 0 1.0 0 0 0 1.0 0 0 0 T 0.6 0 0 1.0 0.3 0 0 1.00.40.2 C 0 0 0 0 0 0 0 0 0.2 0 Information Content at position i: ICi= 2 + SPb(i) * log2(Pb(i) ) b=G,A,T,C Where Pb(i) is the probability of base b at position i Maximum ICif P of some base is 1.0: = 2 + [ (1.0 * 0) + 0 + 0 + 0 ] = 2 Minimum ICif P is 0.25 for all bases: = 2 + [0.25(-2) ] * 4 = 0 If using log2, the info content is in ‘bits’
Information content IC The least variable positions likely are important for specifying the protein-DNA interaction Therefore high information content = low sequence variation at that position. G 0 1.0 0 0 0.71.0 0 0 0.40.8 A 0.4 0 1.0 0 0 0 1.0 0 0 0 T 0.6 0 0 1.0 0.3 0 0 1.00.40.2 C 0 0 0 0 0 0 0 0 0.2 0 IC 1.0 2.0 2.0 2.0 1.1 2.0 2.0 2.0 0.5 1.3 = bit score of 15.9 Information Profile: bits Position
Often for protein-DNA interactions, IC profile is smooth Real motif Randomized data bits bits Position Position
One limitation of PWMs: each position is considered independently • (does not represent inter-dependencies across motif positions)
Gary Stormo, Nat Biotech 2011 Morris et al. , Nat Biotech 2011
Finding matches to (instances of) a PWM G 0 1.0 0 0 0.7 1.0 0 0 0.4 0.8 A 0.4 0 1.0 0 0 0 1.0 0 0 0 T 0.6 0 0 1.0 0.3 0 0 1.0 0.4 0.2 C 0 0 0 0 0 0 0 0 0.2 0 Is the sequenceA G A T T G A T C Ta match to this matrix? Joint probability: assuming each position is independent, P(motif) = PPb(i) b = G,A,T,C i P(sequence | matrix model ) = (0.4)(1.0)(1.0)(1.0)(0.3)(1.0)(1.0)(1.0)(0.2)(0.2) = 0.0048
Finding matches to (instances of) a PWM G 0 1.0 0 0 0.7 1.0 0 0 0.4 0.8 A 0.4 0 1.0 0 0 0 1.0 0 0 0 T 0.6 0 0 1.00.3 0 0 1.0 0.4 0.2 C 0 0 0 0 0 0 0 0 0.2 0 Is the sequenceA G A T T G A T C Ta match to this matrix? Joint probability: assuming each position is independent, P(motif) = PPb(i) Background model: P(G,A,T,C) = 0.25 b = G,A,T,C i P(sequence | matrix model ) = (0.4)(1.0)(1.0)(1.0)(0.3)(1.0)(1.0)(1.0)(0.2)(0.2) = 0.0048 P(sequence | background model ) = (0.25)(0.25)(0.25)(0.25)(0.25)(0.25)(0.25)(0.25)(0.25)(0.25) = 6.8e-24
Log-likelihood ratio LLR = log ( P(sequence | matrix model ) / P(sequence | background model ) ) A measure of how different the likelihood of the sequence is, given the motif model vs. the background model. In our example: LLR = log ( 0.0048 / 6.8e-24 ) = 20.8 The larger the LLR, the more likely the motif model is the right one. To select motifs in real life, can define a LLR cutoff (often defined by sampling).
Finding matches to (instances of) a PWM G 0 1.0 0 0 0.7 1.0 0 0 0.4 0.8 A 0.401.0 0 0 0 1.0 0 0 0 T 0.6 0 0 1.00.3 0 0 1.0 0.4 0.2 C 0 0 0 0 0 0 0 0 0.2 0 Is the sequenceA A A T T G A T C Ta match to this matrix? Joint probability: assuming each position is independent, P(motif) = PPb(i) b = G,A,T,C i P(sequence | matrix model ) = (0.4)(0)(1.0)(1.0)(0.3)(1.0)(1.0)(1.0)(0.2)(0.2) = 0 ** If your PWM was trained on a small sample set, you might have missed some examples = overfitting of the matrix (ie. too specific)
Pseudo-counts: protecting against overfitting due to small sample sizes Add 1 count to each base at each position, then divide by n + 4 Site 1 A G A T G G A T G G T G A T T G A T G T T G A T G G A T G G A G A T T G A T C G T G A T G G A T T G T G A T G G A T T G A G A T G G A T T G Site 2 Site 3 Site 4 Site 5 Site 6 Site 7 Without pseudo-counts: G 0 1.0 0 0 0.71.0 0 0 0.40.8 A 0.4 0 1.0 0 0 0 1.0 0 0 0 T 0.6 0 0 1.0 0.3 0 0 1.00.40.2 C 0 0 0 0 0 0 0 0 0.2 0
Motif finding methods and algorithms Given a set of n promoters of n coregulated genes, find a motif common to the promoters. Both the PWM and the motif sequences are unknown. Common methods: 1. Enumeration: Simplest case: look at the frequency of all n-mers * Finds Global Optimum since can search entire space 2. EM algorithms (MEME): Iteratively hone in on the most likely motif model – can simultaneously identify the motif and find examples of the motif 3. Gibbs sampling methods (AlignAce, BioProspector) Iteratively replace (‘sample’) sites to retrain the matrix