Download
1 / 11
110 likes | 255 Views
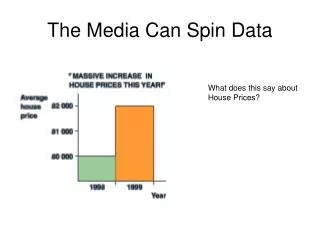
The Media Can Spin Data. What does this say about House Prices?. Notice the Change in Scale!. This is the same data. How does 1995 compare to 1997?. How do they compare now?. What is Wrong with this graph?. Is this just a modest increase at the end?. Look at the Vertical Scale.

E N D
The Media Can Spin Data What does this say about House Prices?
Notice the Change in Scale! This is the same data
What is Wrong with this graph? Is this just a modest increase at the end?
Look at the Vertical Scale The huge increase at the end Was hidden by a changing scale.
Or are there? Was the last pictogram fair as horses are bigger than dogs?
An Advertisement • 2 out of 3 teachers say that every student should buy this study guide.
Which 2 out of which 3 teachers? • If only 3 teachers were sampled, the result doesn’t represent all teachers. • Were the 2 teachers the authors of the study guide? How can we draw a fair conclusion if we don’t have this information?
Homework • Find a misleading advertisement. • All graphs were taken from: • http://www.coolschool.ca/lor/AMA11/unit1/U01L02.htm