Download
1 / 21
210 likes | 237 Views
Learn to identify, graph, and analyze linear functions and equations to represent real-world scenarios. Understand how to determine if a graph represents a function and if it is linear. Practice identifying linear functions using ordered pairs and equations.

E N D
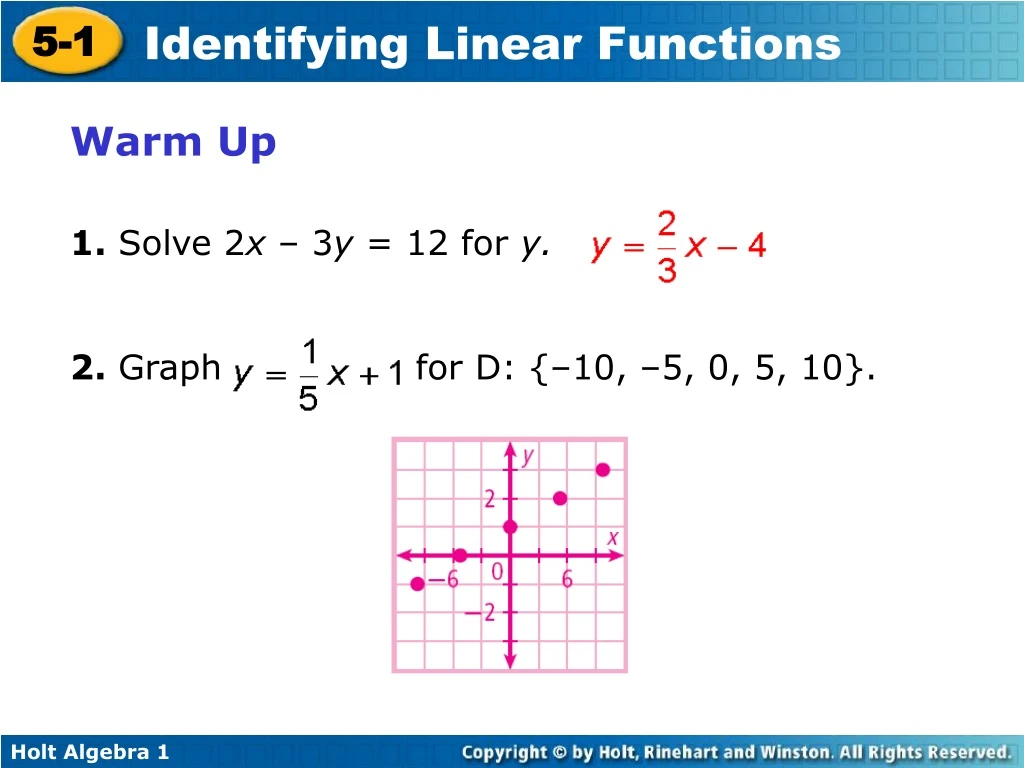
Warm Up 1. Solve2x –3y = 12 for y. 2. Graph forD:{–10, –5, 0, 5, 10}.
Objectives Identify linear functions and linear equations. Graph linear functions that represent real-world situations and give their domain and range.
Vocabulary linear function linear equation
The graph represents a function because each domain value (x-value) is paired with exactly one range value (y-value). Notice that the graph is a straight line. A function whose graph forms a straight line is called a linear function.
Directions: Identify whether the graph represents a function. Explain. If the graph does represent a function, is the function linear?
Example 1 Each domain value is paired with exactly one range value. The graph forms a line. linear function
Example 2 Each domain value is paired with exactly one range value. The graph is not a line. not a linear function
Example 3 Identify whether the graph represents a function. Explain. If the graph does represent a function, is the function linear? The only domain value, –2, is paired with many different range values. not a function
You can sometimes identify a linear function by looking a table or a list of ordered pairs. In a linear function, a constant change in x corresponds to a constant change in y. Directions: Tell whether the set of ordered pairs satisfies a linear function. Explain.
x y +4 +4 +4 +4 +3 +3 +3 +3 Example 5 {(0, –3), (4, 0), (8, 3), (12, 6), (16, 9)} Write the ordered pairs in a table. Look for a pattern. 0 4 8 12 16 –3 0 3 6 9 A constant change of +4 in x corresponds to a constant change of +3 in y. These points satisfy a linear function.
x y +2 +2 +2 +2 –12 –4 +4 +12 Example 6 {(–4, 13), (–2, 1), (0, –3), (2, 1), (4, 13)} Write the ordered pairs in a table. Look for a pattern. –4 –2 0 2 4 13 1 –3 1 13 A constant change of 2 in x corresponds to different changes in y. These points do not satisfy a linear function.
Another way to determine whether a function is linear is to look at its equation. A function is linear if it is described by a linear equation. A linear equation is any equation that can be written in the standard form shown below.
Notice that when a linear equation is written in standard form • x and y both have exponents of 1. • x and y are not multiplied together. • x and y do not appear in denominators, • exponents, or radical signs.
For any two points, there is exactly one line that contains them both. This means you need only two ordered pairs to graph a line. Directions: Write the equation in Standard Form. Tell whether the function is linear.
x = 2y + 4 –2y –2y x –2y = 4 Example 7 x = 2y + 4 Write the equation in standard form. Try to get both variables on the same side. Subtract 2y from both sides. The equation is in standard form (A = 1, B = –2, C = 4). The equation can be written in standard form, so the function is linear.
Example 8 xy = 4 This is not linear, because x and y are multiplied. It is not in standard form.
Example 10 y = 12 The equation is in standard form (A = 0, B = 1, C = 12). The equation can be written in standard form, so the function is linear.
Example 11 y = 2x This is not linear, because x is an exponent.
Lesson Summary: Part I Tell whether each set of ordered pairs satisfies a linear function. Explain. 1. {(–3, 10), (–1, 9), (1, 7), (3, 4), (5, 0)} No; a constant change of +2 in x corresponds to different changes in y. 2. {(3, 4), (5, 7), (7, 10), (9, 13), (11, 16)} Yes; a constant change of +2 in x corresponds to a constant change of +3 in y.
Lesson Summary: Part II Tell whether each function is linear. If so, graph the function. 3. y = 3 – 2x no yes 4. 3y = 12