Warm-ups
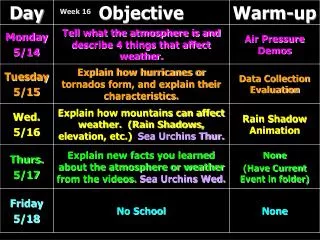
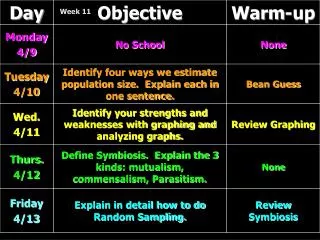
Week 11. Warm-ups. Agenda. Estimating Population Size. Direct Observation (count all org.) Indirect Observation (count signs) Random Sampling (measure small areas, average, multiply by total area) Mark and Recapture (mark some, release, recapture, see % that are marked and apply to pop).

Warm-ups
E N D
Presentation Transcript
Week 11 Warm-ups
Estimating Population Size • Direct Observation(count all org.) • Indirect Observation(count signs) • Random Sampling(measure small areas, average, multiply by total area) • Mark and Recapture(mark some, release, recapture, see % that are marked and apply to pop)
Counting Turtles • Take out Packet and find the page on measuring pop size • From your bag pull out 10 turtles and mark these with a dot on the back in your marker color. • “Release” them back into the ‘population’ • Now 10 of the total are marked, but we don’t know the total • Mix up the turtles well with your hand, then “recapture” a sample of 10 more • Count how many of these are MARKED • THE PERCENTAGE IN THE SAMPLE MARKED IS THE SAME AS THE PERCENT MARKED IN THE TOTAL POPULATION • Create a ratio: 10 marked = # pulled that are marked ? Total10 pulled Cross Multiply, Divide. 10X10 / # = pop
Relationships Symbiosis = a close relationship between two species Other relationships:
Relationships Symbiosis = a close relationship between two species Other relationships:
Graphing • A.C.E. = Answer the Question, Cite Data to prove it Explain the data and why it happened. • Identify a TREND on the graph = MULTIPLE years in a row that the population continues to inc., dec., or remain the same • Include data. Identify the years the trend occurs over, and tell how much the population changed by.
EXAMPLE of a trend: - The number of rabbits went down in the middle. + From year 5 to year 8 the rabbit population decreasedby about 6,000 rabbits.