Download
1 / 43
430 likes | 644 Views
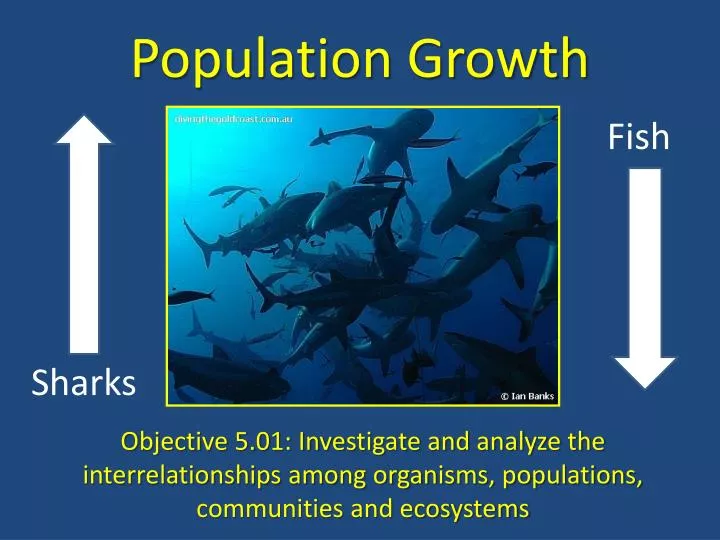
Population Growth. Fish. Sharks. Objective 5.01: Investigate and analyze the interrelationships among organisms, populations, communities and ecosystems. A Population is a group of organisms that belong to the same species and live in a particular place at the same time.

E N D
Population Growth Fish Sharks Objective 5.01: Investigate and analyze the interrelationships among organisms, populations, communities and ecosystems
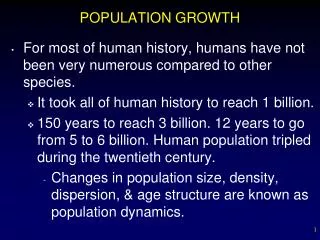
A Population is a group of organisms that belong to the samespecies and live in a particular place at the same time Populationsize refers to the number of individuals in the population.
Populations are usually too large and widespread to count directly, so samplingtechniques are usually used. Sampling is when a small sample is counted and used to estimate the larger population (100 plants x 1,000)
Populationdensity measures how crowded a population is and is always expressed as the number of individuals per unit of area
Over time, all populations change in size and composition due to changes in birthrates, mortalityrates, and lifeexpectancy.
Agestructure refers to the distribution of individuals among different ages. Populations with moreyoungpeople tend to increase more rapidly.
SurvivorshipCurves show the lifeexpectancyrate at different ages of a population. Type I Mortality increases later in life Type II Mortality probability doesn’t change Type III Mortality probability is high early but low later in life
Populationgrowth refers to an increase in the size of a population overtime Population Growth = BirthRate - MortalityRate An increase in birth rate or a decrease in mortality rate will cause an increase in population growth
Population growth can also be affected by immigration, individuals moving in, or emigration, individuals moving out
Immigration and emigration affect a local population’s size but not the world population
Graphs are used to analyze population growth Number of Churches in Ramseur Y axis Number of Churches X axis - Years
LinearGrowth is when the numbers increasesteadilyby the same amount (2, 4, 6…) Number of Churches in Ramseur Y axis Number of Churches X axis - Years
ExponentialGrowth is when the numbers increaseby a largeramount each time (2, 4, 16, 256…) Number of Churches in Raleigh Y axis Number of Churches X axis - Years
Populations tend to increase exponentially in that as they growlarger they begin increasingfaster Slow Increase Rapid Increase
All ecosystems have a limited amount of resources to support populations All organisms need water, food, space for habitats, and sanitary conditions
As populations increase, there is morecompetition for the same resources Populations begin to die out due to disease, starvation, or thirst
Therefore, any ecosystem can only support a certain amount of individuals CarryingCapacity refers to the maximum number of individuals an ecosystem can support
The S – Curve shows logistic growth where a population begins to stabilize as it reaches its carrying capacity The carrying capacity is determined by limitingfactors such as amount of available resources or ability to fight off diseases
Limiting factors that restrain population growth and do not depend upon the initial size of the population are called Density-IndependentFactors Floods Fires Earthquakes Cold Spells Hot Spells Drought
Limiting factors that restrain population growth and do depend upon the initial size of a population are called Density-DependentFactors Food Shortages Water Shortages Diseases Habitat Space
Competitionbetweenspecies that compete for the same resources can also affect population growth Sabel Island Gray Seal Harbor Seal Lance Fish
One population will out compete the other causing a decline in the other population Grey Seal in mixed Harbor Seal in Months
Predator – PreyRelationships also affect Population Growth Increase in predators cause a decrease in prey Decrease in prey causes a decrease in predators Decrease in predators cause an increase in prey Increase in prey causes an increase in predators
There is always a delayedrelationship in growth and decline between the two populations
The Lesson of the Kaibab Kaibab National Forest in Arizona
1906, President Teddy Roosevelt created the Grand Canyon National Game Preserve to protect the “finest deer herd in America” 1905, there was about 4,000 deer on almost 300,000 hectares of land. The carrying capacity was estimated to be about 30,000 deer
By this time though, over grazing by cattle, sheep, and horses had eliminated most of the tall perennial grasses The first step to protect the deer was to ban all hunting of deer as well as extermination of the predators of the deer 1907 – 1939 816 mountain lions, 20 wolves, 7,388 coyotes, and 50 bobcats were killed
The Kaibab Deer Investigating Committee recommended that all livestock not owned by local residents be removed immediately from the range and that the number of deer be cut in half as quickly as possible. Hunting was reopened, and during the fall of 1924, 675 deer were killed by hunters. However, these deer represented only one-tenth the number of deer that had been born that spring. Over the next two winters, it is estimated that 60,000 deer starved to death.
Today, the Arizona Game Commission carefully manages the Kaibab area with regulations geared to specific local needs. Hunting permits are issued to keep the deer in balance with their range. Predators are protected to help keep herds in balance with food supplies. Tragic winter losses can be checked by keeping the number of deer near the carrying capacity of the range.
Early humans were hunters and gathers and their populationsgrew very slowly due to high mortality rates.
The initialincrease in population began when people started civilizations that farmed food together during the agriculturalrevolution.
The BubonicPlague, around 1400’s, led to a sharp decline in the population Europe lost 25% of its population
The currenttrendof human population growth is that of exponentialgrowth. In other words, as the population gets larger, it is increasing faster.
Industrialrevolution, that began in the 1800’s, made obtaining resources even easier. The discovery of antibiotics, vaccines, and other medical improvements lowered the mortality rate
Current World Population 6,815,052,967 World Population 1970 3,912,211,699 World Population 2050 10,299,634,568
Carrying Capacity When ? How ? Who ?
Developingnations are those nations that are not fully industrialized and still use primitive means to farm and live. The average income is far below poverty level. Developing nations include India, those in the Mid-East, Africa, South America, and Asia
The developing nations are growingfaster in populations than the developed nations. Their faster growth places a much larger strain on their natural resources.