Kinematics
370 likes | 510 Views
Kinematics. A note on usage:. The clicker slides in this booklet are meant to be used as stimuli to encourage class discussion. They are intended for use in a class that attempts to help students develop a coherent and sophisticated understanding of scientific thinking.

Kinematics
E N D
Presentation Transcript
A note on usage: The clicker slides in this booklet are meant to be used as stimuli to encourage class discussion. They are intended for use in a class that attempts to help students develop a coherent and sophisticated understanding of scientific thinking. They are NOT intended as items to test whether students are “right or wrong” or “know” the correct answerby one-step recall if enough cues are given. This has a number of instructional implications that are reviewed in general on the next four slides. The individual slides also contain annotations discussing their intended use.
Usage: 1 • Feedback One of the most important values of a clicker-response system is to provide instructors with some understanding of what students are thinking. Good clicker questions can be highly revealing (and surprising). But the critical fact is not that the students make mistakes but to use those mistakes to probe their thinking and find out why. This raises the importance of a rich subsequent discussion well above “letting the students know what the right answer is.”
Usage 2: • Student-student interactions The critical value for student learning occurs in what happens after a clicker question has obtained a mixed response from the students. The standard next cue is, “Find someone who disagreed with the answer you chose and see if you can convince them.” After a minute or two of discussion, a second click may show students having moved dramatically towards the correct answer. A brief call for who changed their answer and why can lead to a useful exchange. When they have not moved significantly, more discussion is called for.
Usage: 3 • Incompletely specified questions Some items have questions that are simple if idealized assumptions are made, subtler if they are not. Part of the discussion of these items are intended to include issues of modeling, idealizations, and hidden assumptions. • Questions where answers are not provided. In these items, the intent is to have students come up with potential answers and have the instructor collect them and write them on the board. Occasionally, especially at the beginning of a class, it may take some time before students are willing to contribute answers. It can help if you have some prepared answers ready, walk around the class, and put up the answers as if they came from the students. This can help students get more comfortable with contributing.
Usage: 4 • Cluster questions Some questions are meant to be used as part of a group of questions. In this case, resolving the answers to individual questions is better left until the entire group is completed. The value of the questions are often in the comparison of the different items and in having students think about what changes lead to what differences and why. • Problem solving items In these items (indicated by a pencil cluster logo), the intent is to have students work together to solve some small problem. After a few minutes, ask the groups to share their answers, vote on the different answers obtained, and have a discussion.
The 1D velocity is defined asWhat is true about this velocity? • It is always positive. • It is only negative if x is negative. • It can be positive or negative but only for positive x. • It can be positive or negative for both positive and negative x.
Example • If I place the sonic ranger at the left side of the room and you walk slowly towards it at almost a constant velocity what will the position graph look like? • Generate the graph on your whiteboard.
x x x x x x (1) (5) (2) (6) t t t t t t (3) (4)
Example • If I place the sonic ranger at the left side of the room and you walk slowly towards it, at almost a constant velocity what will the velocity graph look like? • Discuss with your group and sketch the consensus graph on your whiteboard.
v v v v v v (1) (5) (2) (6) t t t t t t (3) (4)
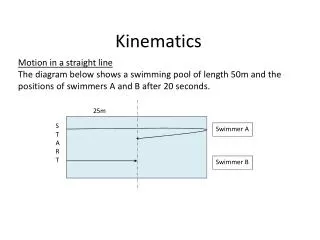
A person initially at point P in the illustration stays there a moment and then moves along the axis to Q and stays there a moment. She then runs quickly to R, stays there a moment, and then strolls slowly back to P. Which of the position vs. time graphs below could correctly represent this motion if the scales were correct?
Graphing Velocity: Figuring it out from the motion An object in uniform motion has constant velocity. This means the instantaneous velocity does not change with time. Its graph is a horizontal line. You can make sense of this by putting your mind in “velocity mode”and running a mental movie.
Example • How do you have to walk to make the sonic ranger produce the following velocity graph? • Draw the position graph.
Example x x • A ball rolling on a level track travels at almost a constant velocity. Assuming it takes a negligible time to get up to speed, what does the graph of its position look like as a function of time?
Please make your selection... x x x x x x (1) (2) t t t t t t (5) (6) (3) (4) (7) other
Example v v • A ball rolling on a level track travels at almost a constant velocity. Assuming it takes a negligible time to get up to speed, what does the graph of its velocity look like as a function of time?
Please make your selection... v v v v v v (1) (2) t t t t t t (5) (6) (3) (4) (7) other
Example x x • A ball rolls is rolling at a constant speed along a horizontal track as shown. It comes to a hill and has enough speed to get over it. By thinking about its speed as it goes, sketch a graph of the positionof the ball as a function of time.
Please make your selection... x x x x x x (1) (2) (6) (3) (4) (5) t t t t t t (7) other
Example v v • A ball rolls is rolling at a constant speed along a horizontal track as shown. It comes to a hill and has enough speed to get over it. By thinking about its speed as it goes, sketch a graph of the velocityof the ball as a function of time.
For each of the next three clicker problems, write on your white board The variable The number of the graph you chose A sketch of the graph you chose (with the axes labeled)
A small toy car can move along a horizontal track. Its position is measured by a sonic ranger. When the motion detector is turned on the car is moving towards the left and is slowing down at a uniform rate. Which would be the graph of velocity shown on the screen?
A small toy car can move along a horizontal track. Its position is measured by a sonic ranger. When the motion detector is turned on the car is moving towards the left and is slowing down at a uniform rate. Which would be the graph of position shown on the screen?
A small toy car can move along a horizontal track. Its position is measured by a sonic ranger. When the motion detector is turned on the car is moving towards the left and is slowing down at a uniform rate. Which would be the graph of acceleration shown on the screen?
Are your three graphs consistent? Discuss your choices with your working group. What did you decide? 1. The were all consistent. 2. Two were consistent but a one was not. 3. They were not at all consistent.
Figuring out acceleration • Look at the y-t, and vy-t plots for a ball thrown by a juggler and going up and down. • Acceleration is the derivative of the velocity. How is the velocity changing? Why?
When the ball is at the highest point what is its velocity? • Positive (upward) • Negative (downward) • Zero • Cannot be determined
When the ball is at the highest point what is its acceleration? • Positive (upward) • Negative (downward) • Zero • Cannot be determined
This graph shows the altitude of one of balls in the juggler video after he has relased it and before he touches it again. Where is the ball at its highest point? • A. • B. • C. • You can’t tell. B A C
This graph shows the velocity of one of balls in the juggler video after he has relased it and before he touches it again. Where is the ball at its highest point? • A. • B. • C. • A and C • You can’t tell. A B C
Which of these graphs looks like the acceleration graph for the situation shown on the previous two slides? • A • B • C • D • None of these
What does the previous result tell us about the net force the ball feels when nothing is touching it? Discuss
In the figure below is shown a graph of the position of a vesicle that was observed to move along a straight line.* At what instant of time is the vesicle moving with the highest speed? • Force-Velocity Curves of Motor Proteins Cooperating In Vivo, • Y. Shtridelman, et al., Cell BiochemBiophys. 52(1): 19–29 (2008).
In the figure below is shown a graph of the position of a vesicle that was observed to move along a straight line.* At what instant of time is the vesicle moving with the slowest speed? • Force-Velocity Curves of Motor Proteins Cooperating In Vivo, • Y. Shtridelman, et al., Cell BiochemBiophys. 52(1): 19–29 (2008).
In the figure below is shown a graph of the position of a vesicle that was observed to move along a straight line.* At what instant of time is the vesicle magnitude of the vesicle’s acceleration the largest? • Force-Velocity Curves of Motor Proteins Cooperating In Vivo, • Y. Shtridelman, et al., Cell BiochemBiophys. 52(1): 19–29 (2008).
In the figure below is shown a graph of the position of a vesicle that was observed to move along a straight line.* At what instant of time is the vesicle feeling a net force of the greatest magnitude? • Force-Velocity Curves of Motor Proteins Cooperating In Vivo, • Y. Shtridelman, et al., Cell BiochemBiophys. 52(1): 19–29 (2008).