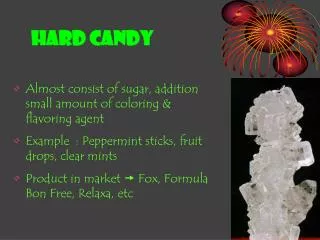
Candy Capability
Candy Capability. Operations Management Dr. Ron Lembke. Tolerance Limits for food?. Underfilling who would notice? Overfilling – would anyone care?. Packaged Goods. What are the Tolerance Levels? What we have to do to measure capability? What are the sources of variability?.

Candy Capability
E N D
Presentation Transcript
Candy Capability Operations Management Dr. Ron Lembke
Tolerance Limits for food? • Underfilling who would notice? • Overfilling – would anyone care?
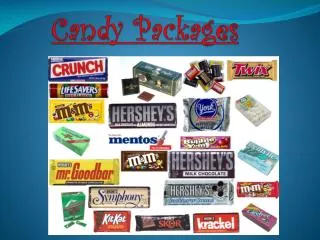
Packaged Goods • What are the Tolerance Levels? • What we have to do to measure capability? • What are the sources of variability?
Production Process Make Candy Make Candy Make Candy Mix Package Put in big bags Make Candy Mix % Wrong wt. Wrong wt. Make Candy Make Candy Candy irregularity
Weighing Package and all candies • Before placing candy on scale, press “ON/TARE” button • Wait for 0.00 to appear • If it doesn’t say “g”, press Cal/Mode button a few times • Write weight down on form
Candy colors • Write Name on form • Write weight on form • Write Package # on form • Count # of each color and write on form • Count total # of candies and write on form • (Advanced only): Eat candies • Turn in forms and complete wrappers
Your Job • Write down package # • Weigh package and candies, all together, in grams and ounces • Write down weights on form • Optional: • Open package, count total # candies • Count # of each color • Write down • Eat candies • Turn in form and empty complete wrappers for weighing
Peanut Candy Weights • Avg. 2.18, stdv 0.242, c.v. = 0.111
Plain Candy Weights • Avg 0.858, StDev 0.035, C.V. 0.0413
Mini Candy Weights • Avg 0.288, StDev 0.020, C.V. 0.070
Peanut Color Mix website • Brown 17.7% 20% • Yellow 8.2% 20% • Red 9.5% 20% • Blue 15.4% 20% • Orange 26.4% 10% • Green 22.7% 10%
Plain Color Mix Class website • Brown 12.1% 30% • Yellow 14.7% 20% • Red 11.4% 20% • Blue 19.5% 10% • Orange 21.2% 10% • Green 21.2% 10%
So who cares? • Dept. of Commerce • National Institutes of Standards & Technology • NIST Handbook 133 • Fair Packaging and Labeling Act
NIST Fines • Don’t get caught • It’s embarassing • You’ll look dumb
How Many Servings? 264.8g /36g = 7.35 servings 267.9g /45g = 5.95 servings
Not for Retail Sale • Why Not? • Ingredients • Nutritional information • Peanut/allergy information • Need room for cute pics • Process variability?
Package Weight • “Not Labeled for Individual Retail Sale” • If individual is 18g • MAV is 10% = 1.8g • Nothing can be below 18g – 1.8g = 16.2g
Too Much Variability 10.9% of sample below 16.2g! Avg= 17.57, stdev 1.42
Suppose they wanted to • Stated weight = 18g, MAV = 16.2g • Suppose want 99.7% chance nothing below MAV • Set the average to be 3σ above MAV • σ = 1.42g, so set Avg = 16.2 + 3*1.42 = 20.46 • You pay for 18g, they give you 20.46g! • 13.7% Free! They have to give away 1/7th of the candy! • Clearly, they aren’t going to do this!
Summary • Many reasons M&M’s “Not for Individual Sale” • Process variability seems to be an important one, if not the major one • Process variability is a very important consideration for companies. • BTW, one bag was 223.6g < 264.8